
Bitcoin’s $100K hold explained: It’s not retail, it’s a liquidity shortage
Analysis

Will Avalanche [AVAX] crash deeper? Why $14.5 support is bears’ new target
Posted:
Journalist
![Will Avalanche [AVAX] crash deeper? Why $14.5 support is bears' new target](https://ambcrypto.com/wp-content/uploads/2025/03/Avalanche-Featured-1-1200x675.webp)
- Technical analysis showed multiple reasons why the $20 area was a formidable resistance zone for AVAX bulls.
- A minor price bounce was possible, but a bearish move was likely to commence soon.
In early March, Avalanche [AVAX] was forecast to see a 10% price bounce, but the downtrend was expected to continue, and this had come to pass.
Later, a price drop to $14 was anticipated in an analysis, and AVAX fell to $15.2 a week later.
The bearish outlook remained in place. The demand was not strong enough to coax Avalanche out of its downtrend, and firm resistance zones were overhead.
Swing traders might want to look for short entries or remain sidelined for the coming days.
Avalanche set to maintain bearish trajectory
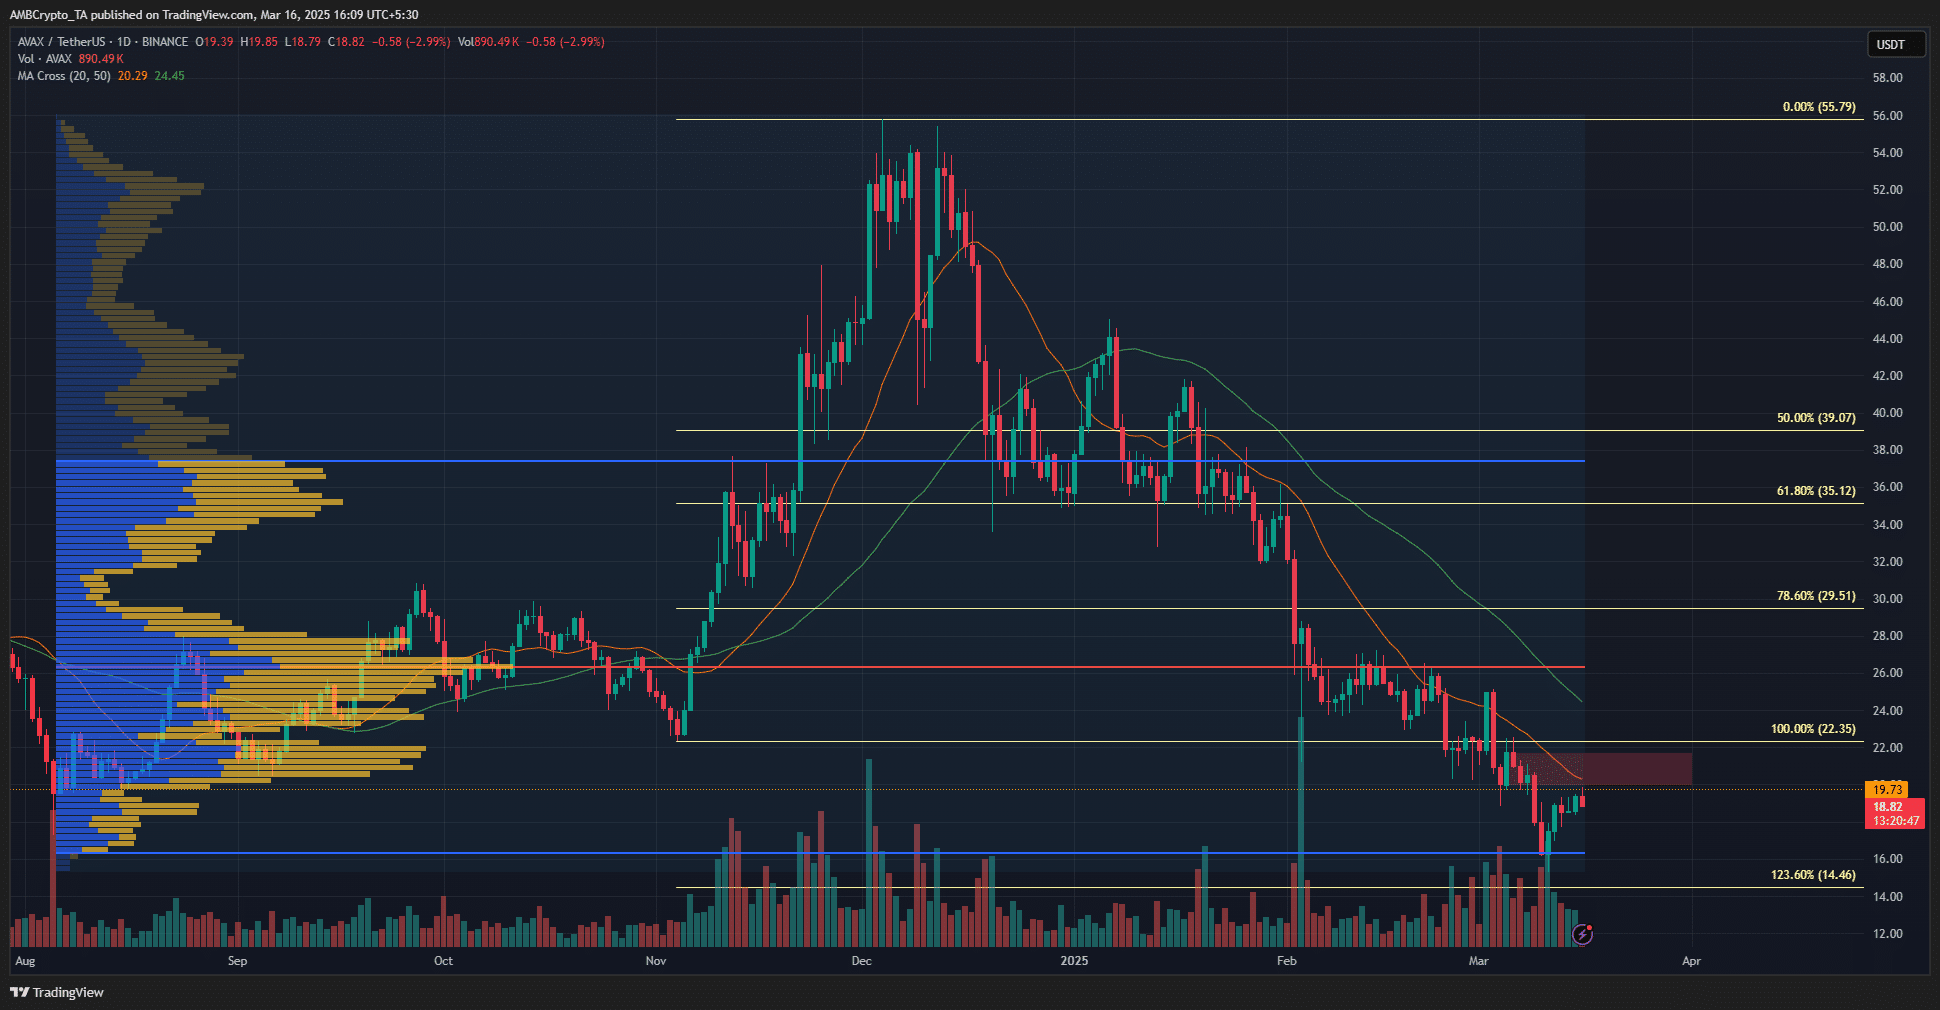
Source: AVAX/USDT on TradingView
The November rally was wholly retraced by the 24th of February. Since then, Avalanche has shed another 14% on the price chart.
The trading volume has also been relatively high during the drop, highlighting intense selling pressure.
The 20 and 50-period moving averages showed steady downward momentum. The 20 DMA acted as dynamic resistance to the price in the past two weeks as well. At press time, the 20 DMA was at $20.29.
The $20-$21.7 region formed a resistance zone, as it was a bearish order block. Any AVAX price bounce would likely be checked by the sellers.
Moreover, the Fixed Range Volume Profile tool showed that the $20.5-$22.1 area was a high-volume node, reinforcing the strength of the resistance.
The tool was plotted from the August lows to press time and marked the Point of Control at $26.36.
The daily market structure was bearish, and the recent lower high was set at $24.95. A daily session close above this level is required to shift the structure bullishly. At press time, such a move appeared unlikely.
The Fibonacci retracement and extension levels showed that the 23.6% extension level at $14.46 was the next target.
Swing traders can look to sell a short-term price bounce toward $21 and target this level as a take-profit. The bearish idea would be invalidated if the price could climb above $22.15.
Disclaimer: The information presented does not constitute financial, investment, trading, or other types of advice and is solely the writer’s opinion


