
- Bitcoin’s exchange reserves suggested that selling pressure was high
- Market indicators hinted at a bullish trend reversal
Bitcoin [BTC], despite a brief bout of recovery, is struggling once again after its price slipped below $55,000 on the charts. In the meantime, an institutional investor deposited BTC worth millions of dollars, fueling sell-off concerns. Does this mean that BTC may be poised to see yet another price correction in the coming days?
Are investors selling BTC?
Bitcoin, like most other cryptos, also recorded a price drop last week as the coin’s price plummeted by nearly 8%. The bearish price trend continued in the last 24 hours because it dipped by over 2%. At the time of writing, BTC was trading at $54,284.69 with a market capitalization of over $1 trillion.
While that happened, a large-scale investor sold a substantial amount of BTC. To be precise, Galaxy Digital deposited 1,458 BTC worth $78.5 million to Coinbase Prime. This update from Lookonchain suggested that whales are now selling BTC. Whenever whales sell BTC, it means that they are expecting an asset’s price to drop further.
Hence, it’s worth taking a lot at other datasets to see whether selling pressure on the coin has been rising or not.
According to AMBCrypto’s analysis of CryptoQuant’s data, Bitcoin’s exchange reserves have risen lately. By extension, this meant that selling pressure on the coin has been high.
Apart from that, at press time, both BTC’s Coinbase Premium and Funds Premium were red – A sign that selling sentiment was dominant among U.S and institutional investors.

Source: CryptoQuant
What do the market indicators suggest?
We then assessed the crypto’s metrics to find out whether they also hinted at a further price correction.
As per our analysis of Glassnode’s data, BTC’s NVT ratio fell on the charts. Whenever that happens, it suggests that an asset is undervalued, hinting at a price hike.
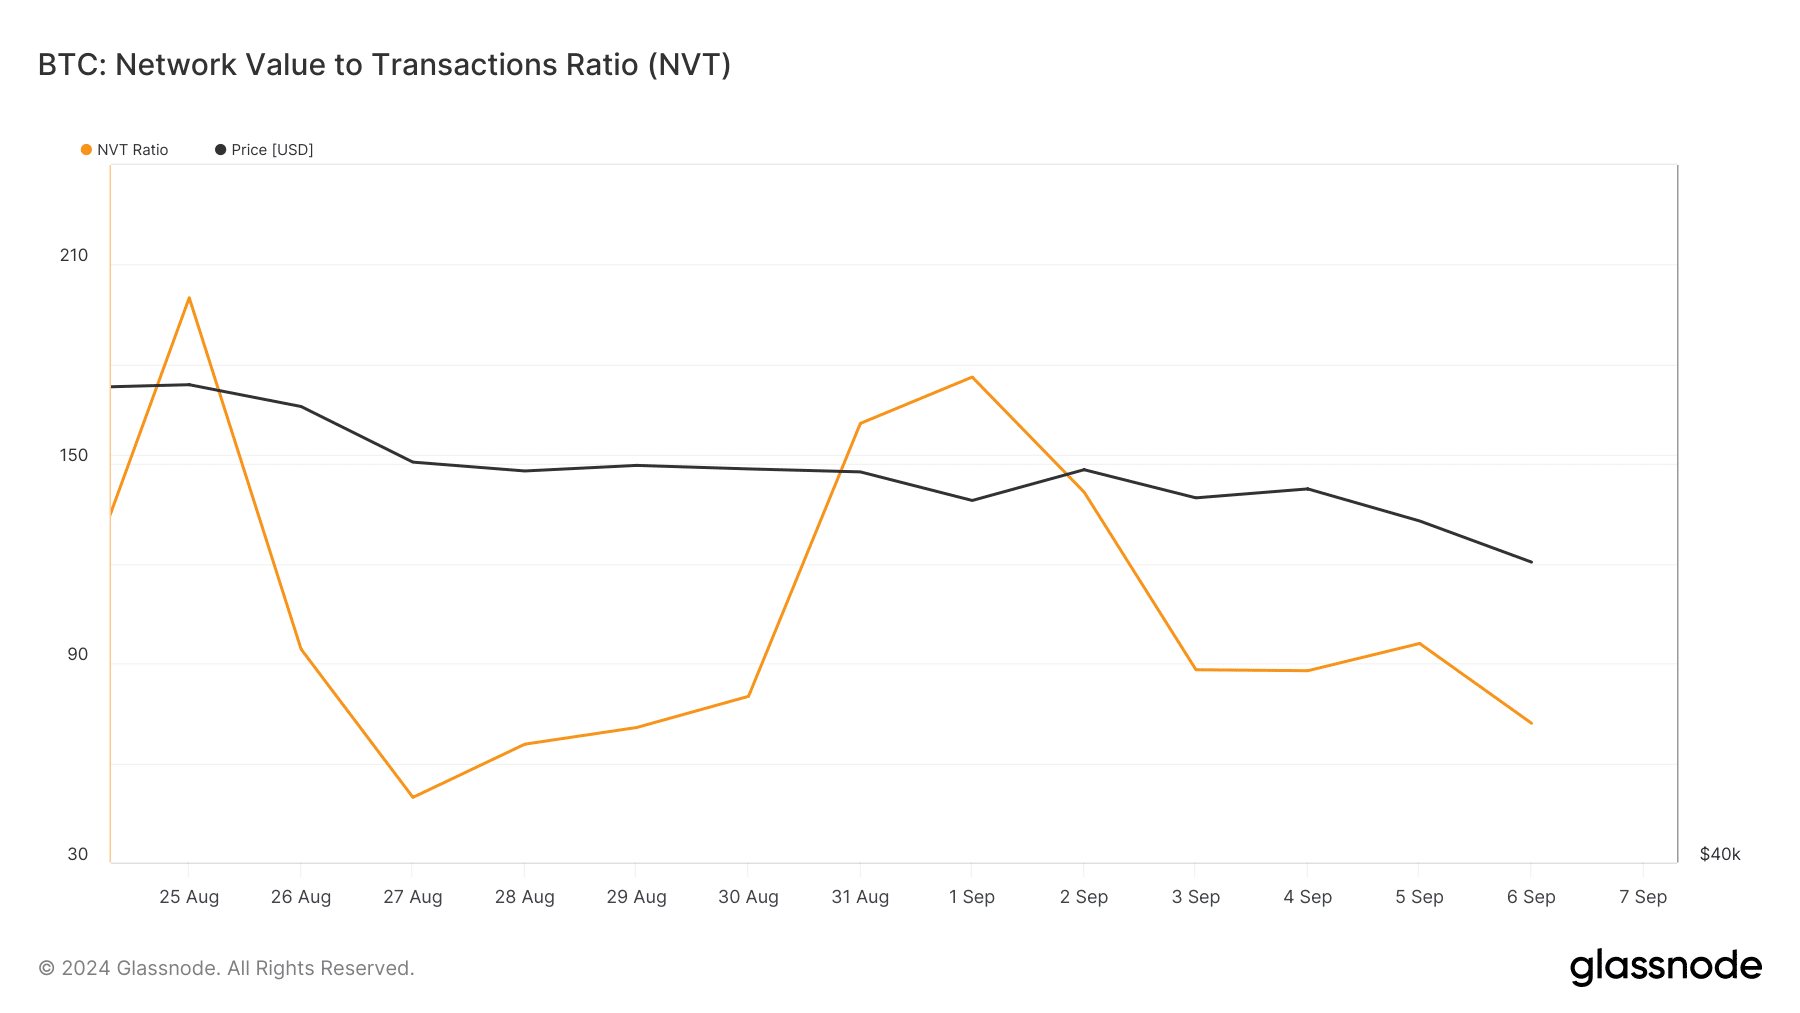
Source: Glassnode
Additionally, BTC’s aSORP was green, meaning that more investors have been selling at a loss. In the middle of a bear market, it can indicate a market bottom.
Also, its binary CDD implied that long-term holders’ movement in the last 7 days was lower than the average. They have a motive to hold their coins. This can be inferred as a bullish signal.

Source: CryptoQuant
Hence, we took a look at the coin’s daily chart to better understand which way it may be heading. Our analysis revealed that BTC seemed to be testing a support level. The coin’s price also touched the lower limit of the Bollinger Bands, which often results in price hikes.
Read Bitcoin’s [BTC] Price Prediction 2024–2025
Finally, both its Relative Strength Index (RSI) and Chaikin Money Flow (CMF) registered upticks too – Again, indicator of an upcoming hike.
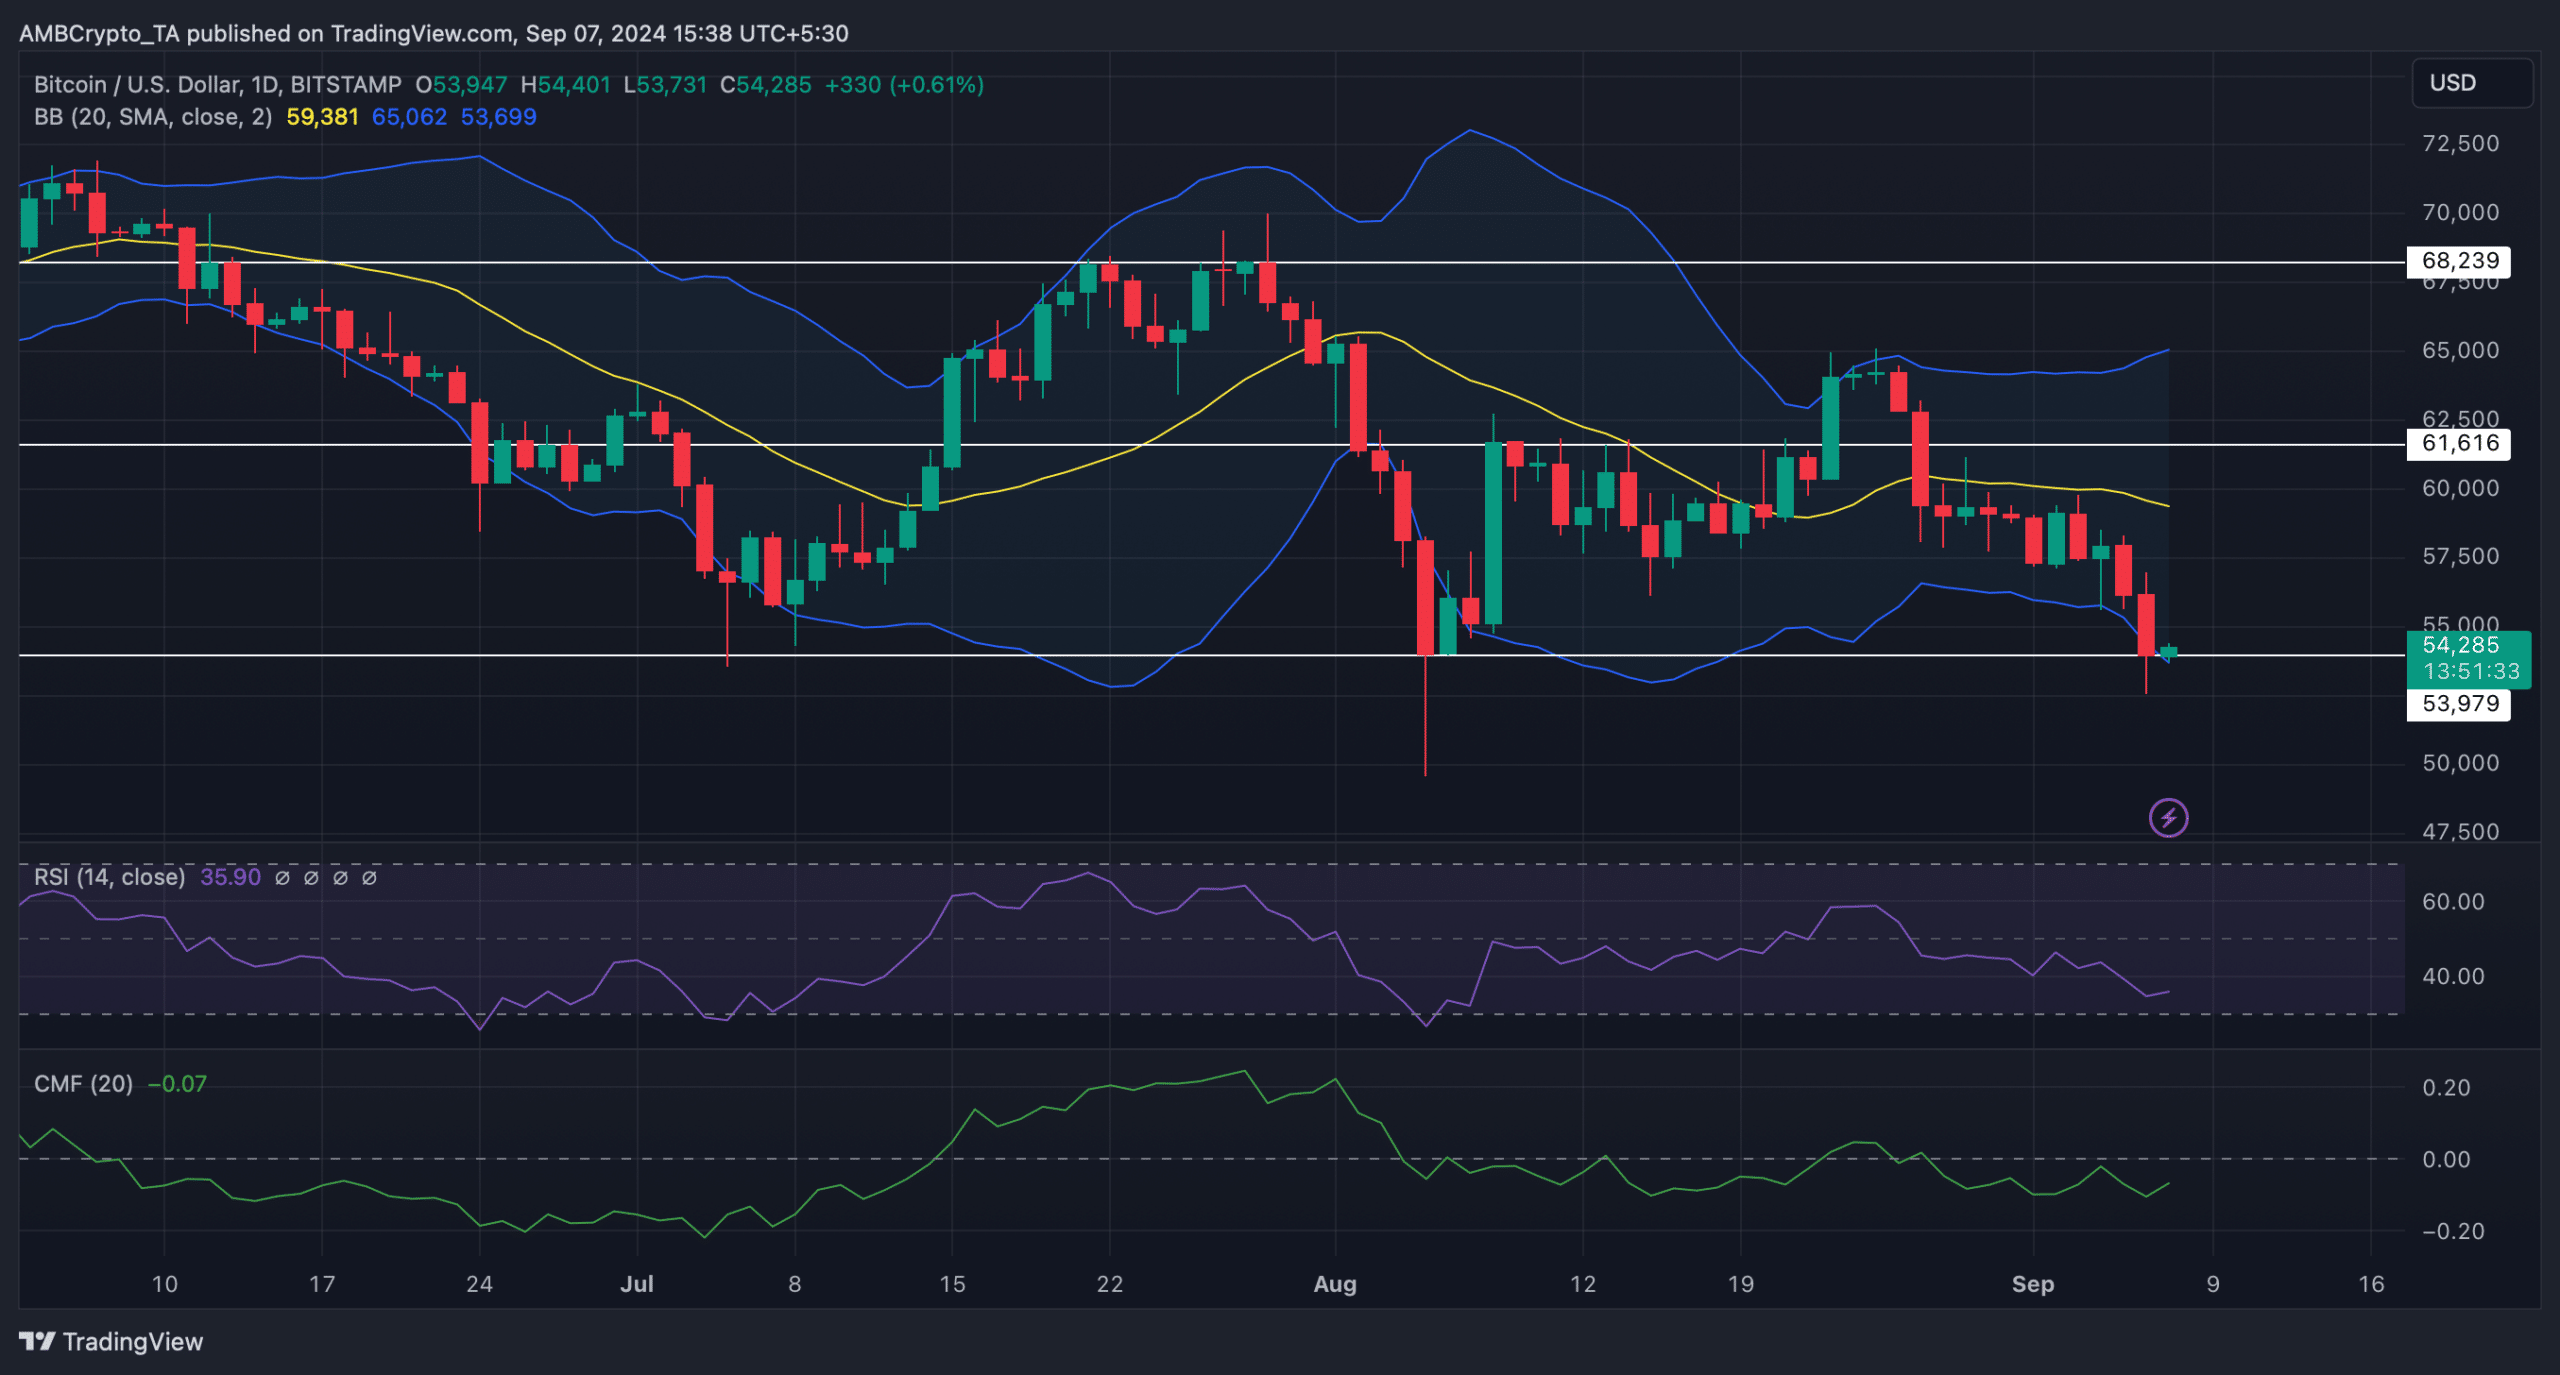
Source: TradingView