Over the past 48-hours, Bitcoin has struggled to breach above its immediate resistance at $47400. The same range was acting as resistance during the recovery but the asset has fallen below the initial drop over the past 24-hours. While signs of a bullish pullback have been few over the past few days, some on-chain data suggested signs of long-term price scaling towards a global top.
Bitcoin Adjusted SOPR, Funding Rate indicates re-set
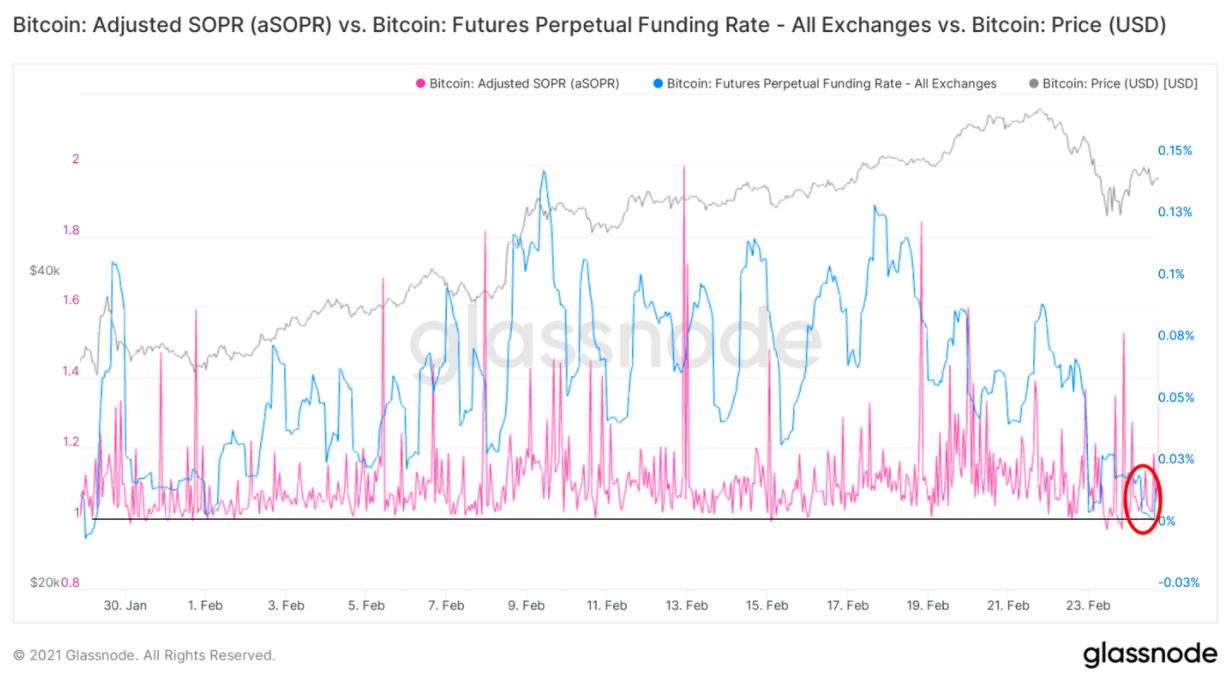
Source: Glassnode
A timely re-set of important metrics is essential during any bullish rally. Several indicators were reaching a significant top and Adjusted SOPR was one of them. The SOPR indicator highlights the sentiment of hodlers in terms of the overall profit or loss witnessed. The Adjusted SOPR is a derivative but it ignores transactions/addresses/outputs that have a time period of 1 hour or less.
The chart above illustrated a cool-off period for the indicator, which suggested that there was more room for growth in the future. Similarly, the funding rate appeared to undergo a reset, indicative that the foundation for the next leg up is settling with these metrics.
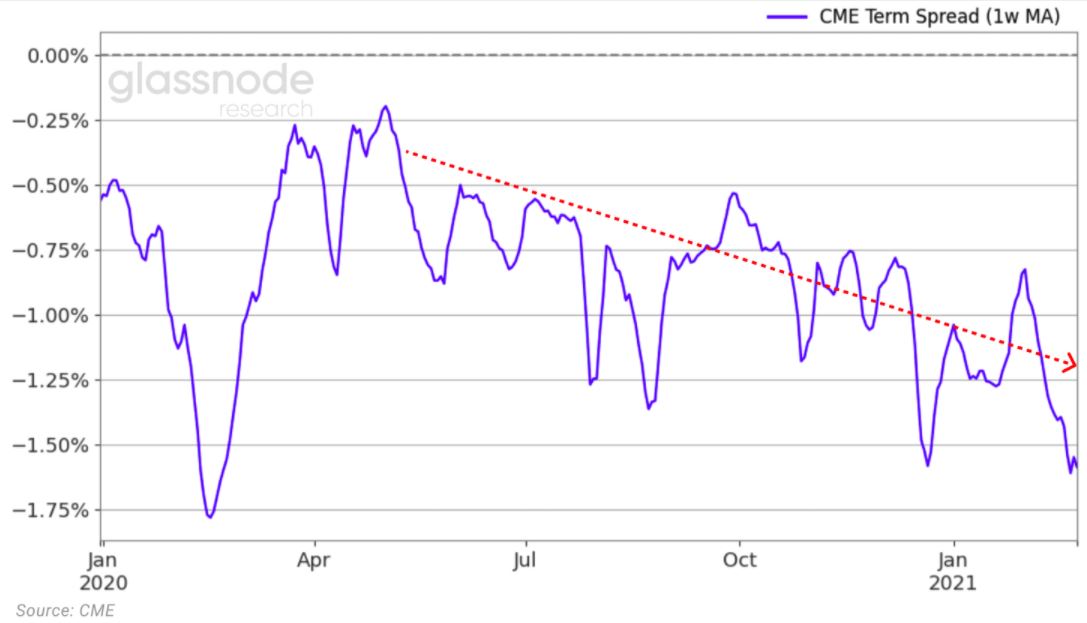
Source: Glassnode
Accredited Investors were feeling confident as well, as the CME gap appeared to re-set during the recent consolidation. The term spread is heading towards a contango phase, suggesting that higher prices are expected in the future. Glassnode’s report added,
“This higher expectation in prices is further highlighted in the options open interest. As of February 24th, there are 6k call options with strike prices between 80-100k.”
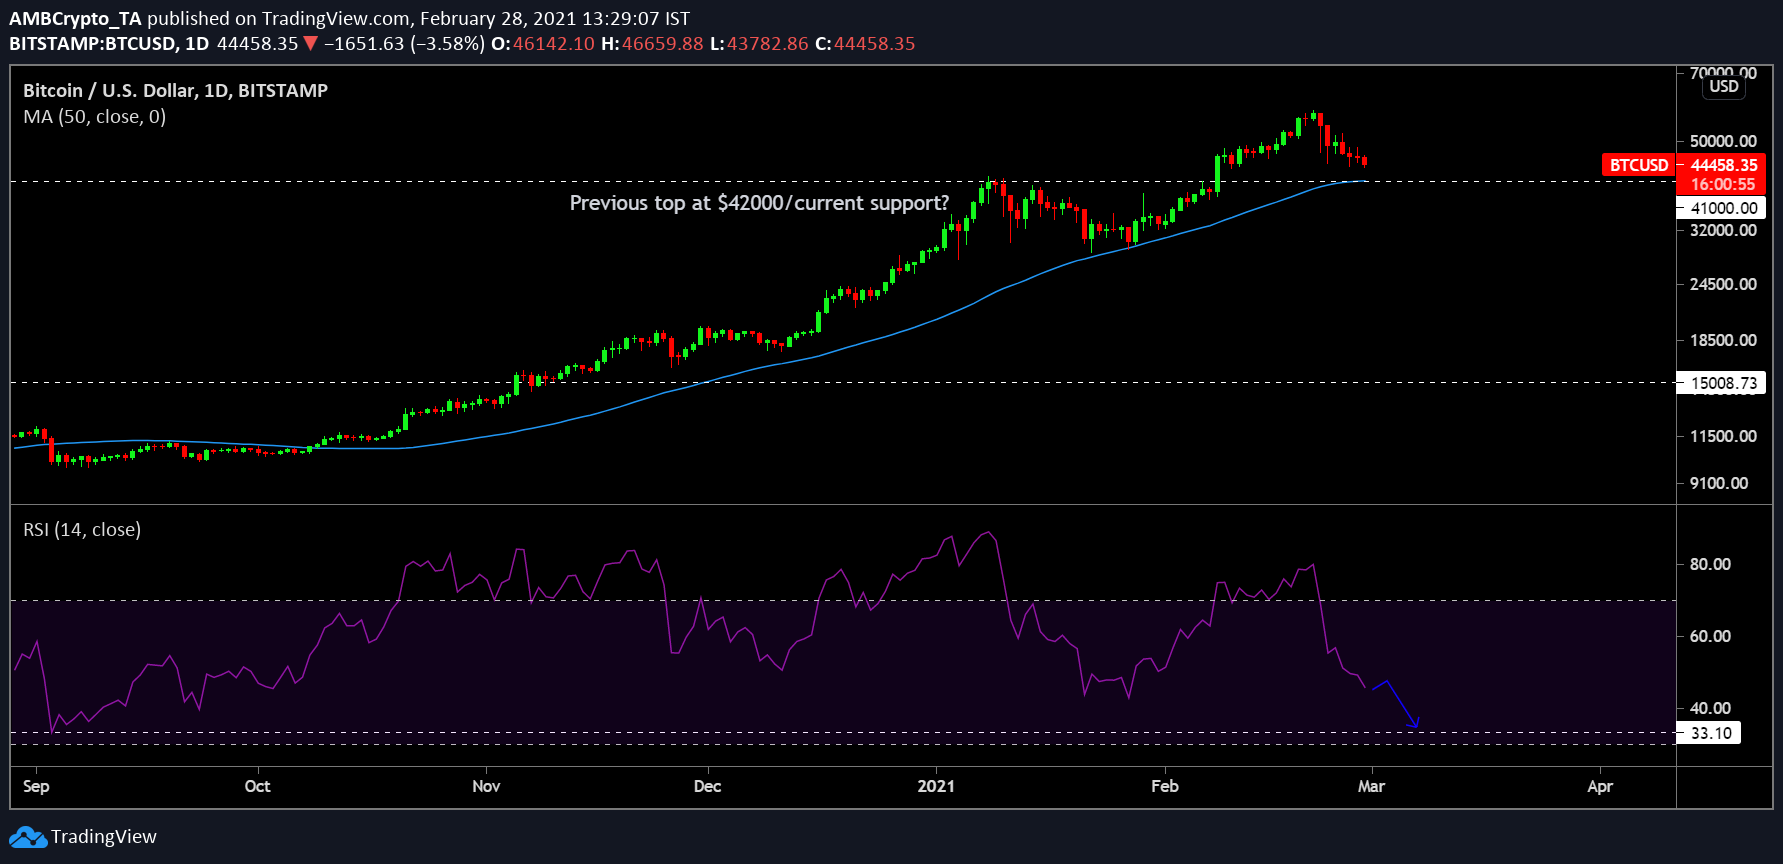
Source: Trading View
From a purely market structural perspective, the asset could drop down to $40k-$42k due to its recent struggles with the $47,400 range. The mentioned range is also critical since it was the previous top registered on 8th January, after the rally started during the month of December. From $42,000, Bitcoin had dropped down to $29,000 before climbing up to its new ATH at $58k.
Based on indicators, a drop down to $40,000-$42,000 will exhibit a re-test of the 50-Moving Average as well, which may support the prices to move higher thereon.
The Relative Strength Index or RSI will possibly exhibit a massive re-set near the oversold region, which was last witnessed on 1st September 2020 on the daily chart.