


- Bitcoin may rise, but a significant downtrend remains feasible.
- Traders who eye $45,000 with high leverage may be liquidated.
Crypto Analyst Ali Martinez posted that Bitcoin [BTC] has the potential to hit $50,000. But Martinez also noted the rise to the landmark could come with a negative after-effect.
According to his post on X (formerly Twitter), historical data from 2016 and 2019 supports the possible move.
However, he opined that BTC could face a 40% correction. This is because the coin would have hit the 0.786 Fibonacci retracement level.
In 2016 and 2019, after finding a market bottom, #Bitcoin's first major correction occurred upon reaching the 0.786 Fibonacci retracement level.
Drawing from this pattern, if history repeats itself, $BTC may climb further toward $50,000 before experiencing a 40% correction. pic.twitter.com/Gh9dDYEaQH
— Ali Charts (@alicharts) December 29, 2023
BTC to take it back in time?
AMBCrypto observed the chart Martinez shared. According to the details, there was a 40.37% correction after Bitcoin rose above $1,000 in 2016.
A similar occurrence happened in 2019 as BTC crossed $16,000. After that, it experienced a 53.64% dip.
In many instances, Bitcoin has followed historical data with its performance. So, the same thing may happen with the price action going into the new year.
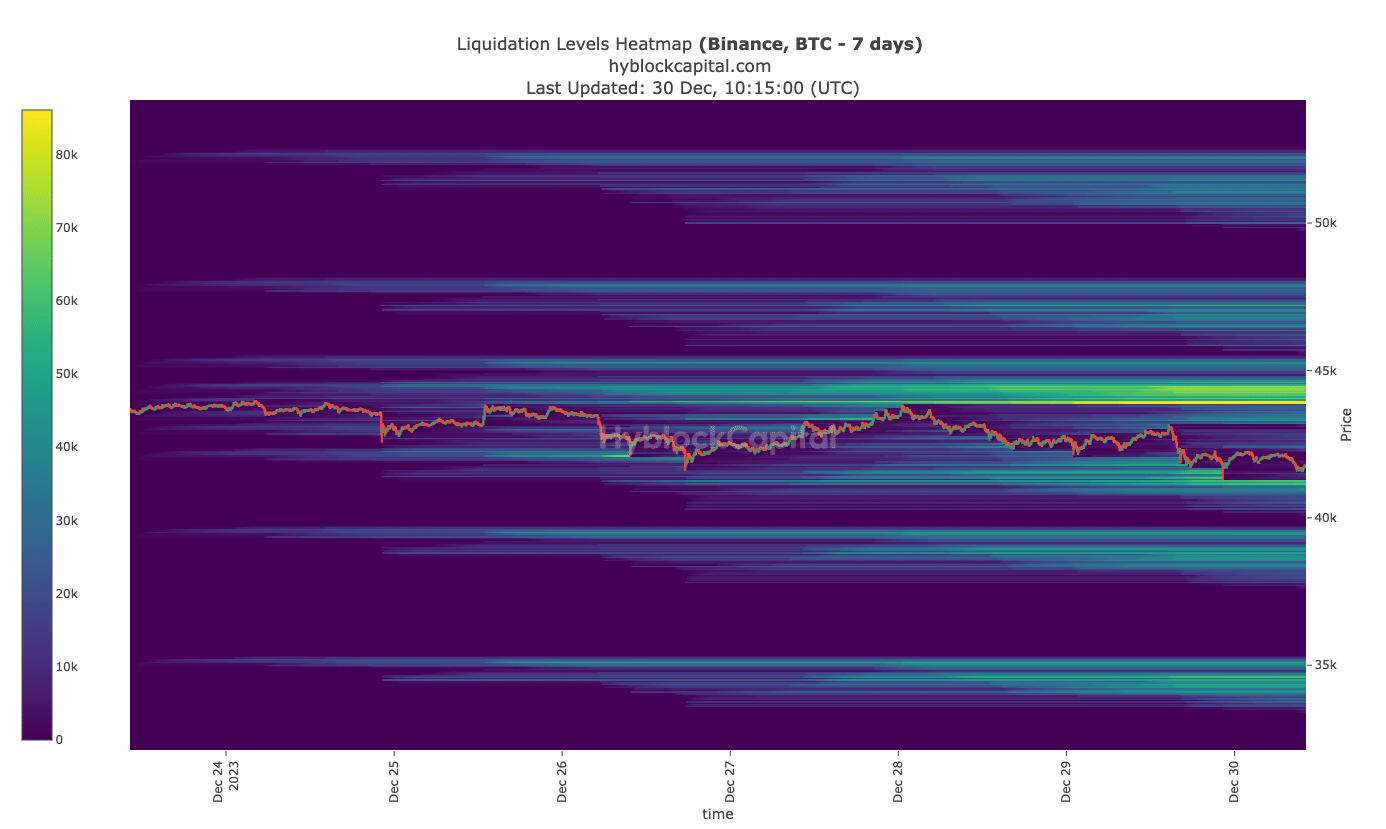
However, indications from the Liquidation HeatMap showed that Bitcoin might find it hard to hit $45,000.
This is because there was a cluster (in yellow) of liquidity leading to the region. If traders decide to open positions targeting $44,600 or thereabout with a high leverage, they may be liquidation.
So, it is better to employ caution as BTC might continue in consolidation.
The image above also aligned with AMBCrypto’s previous articles, which projected a price decrease for the coin. Per the price action, the Exponential Moving Average (EMA) showed that BTC had bullish tendencies.
This was because the 50 EMA (blue) had crossed over the 200 EMA (yellow).
Caution in the short-term
However, it is important to note that this bullish bias was for the long term. So, investors looking to buy Bitcoin for a short period should lower expectations.
For the short term, the Aroon Up (orange) trended downwards. It was the same with the Aroon Down (blue) indicator. Positions like this suggest that BTC might trade sideways for the time being.

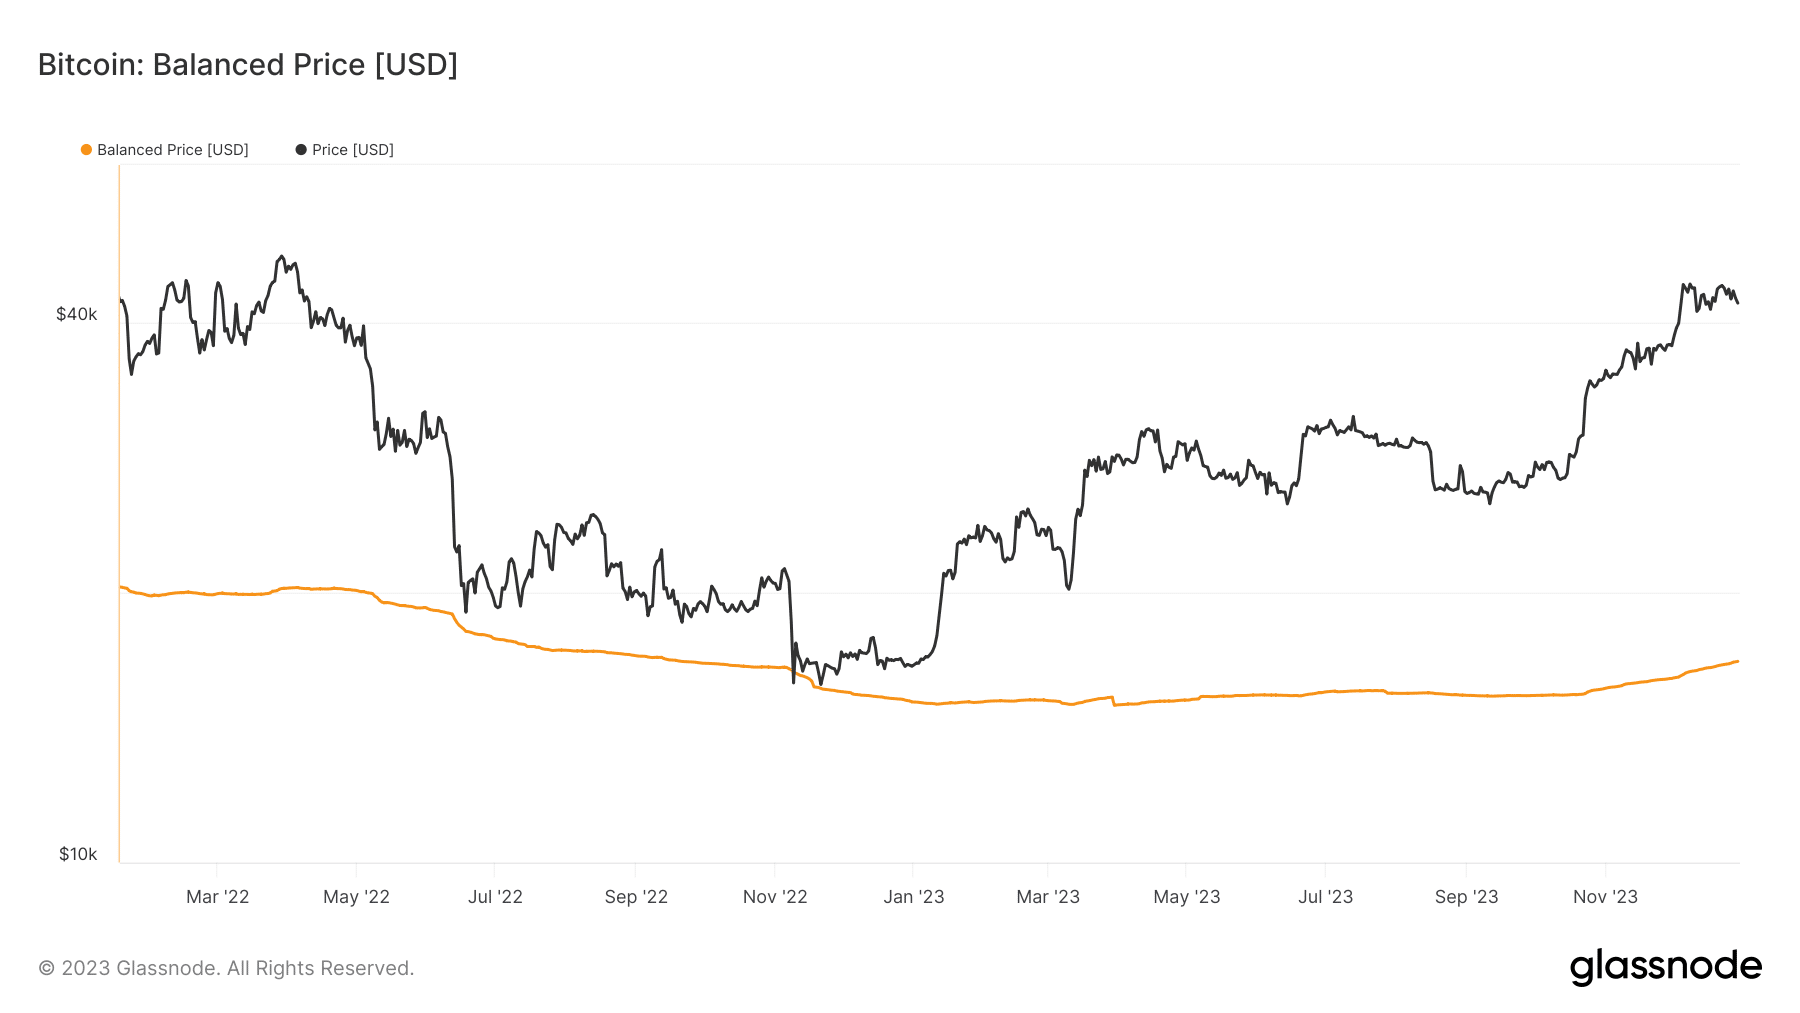
Concerning the on-chain condition, AMBCrypto evaluated the Blanaced Price via Glassnode. The Balanced Price is the difference between the Realized Price and the Transfer Price.
For context, the Transfer Price is the sum of Coin Days Destroyed in USD, adjusted by circulating supply and total time since Bitcoin’s inception.
How much are 1,10,100 BTCs worth today?
As a result, the Balanced Price can identify market bottoms. At press time, Bitcoin’s Balanced Price was $16,370. This value indicates that the coin has massive upside potential.
However, it might take a while before the value rises. As it stands, BTC might hit $50,000. But investors should watch out if a significant correction occurs afterward, as it could present an unprecedented buying opportunity.