Will Bitcoin’s price touch $25,000 mark in near term? Analysts suggest….
As Bitcoin [BTC] accumulation slows down, analysts predict a further decline to the $25,000 territory.

- Two CryptoQuant analysts have opined that BTC’s price will fall below $25,000.
- BTC’s selling pressure has outweighed its buying pressure in the past few days.
As Bitcoin’s [BTC] weighted sentiment lingers in the negative territory, CryptoQuant analyst Baro Virtual, in a new report, opined that the king coin’s price could fall below $25,000 as long as bearish sentiments remain in the market.
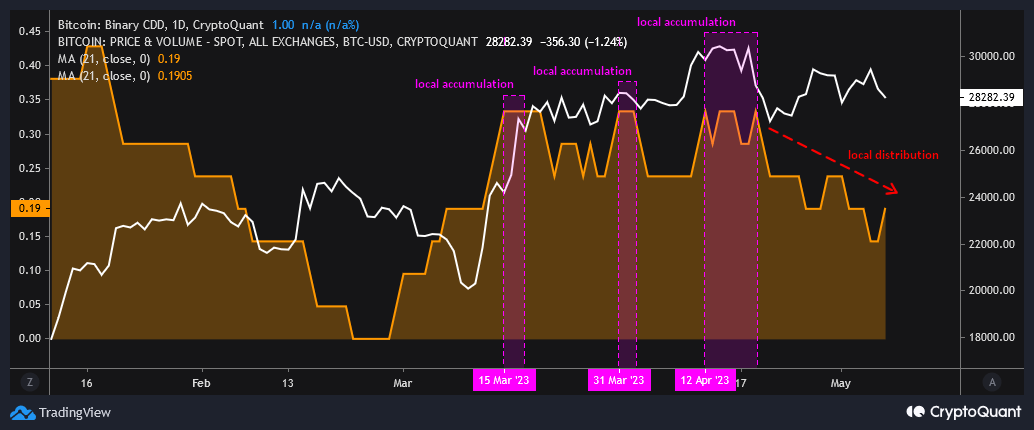
Baro’s conclusion was based on an assessment of BTC’s Coin Days Destroyed (CDD) on a 21-day moving average. This metric tracks the number of cryptocurrency coins that have been inactive for a certain period of time and then suddenly moved.
According to Glassnode Academy, it is calculated by multiplying the number of coins that have been inactive by the number of days they have been inactive.
According to Baro, BTC’s CDD metric revealed that the king coin enjoyed three periods of local accumulation on 15 March, 31 March, and 12 April, respectively, after which a period of local distribution began on 20 April.
Local distribution occurs when investors take to selling their holdings, causing the price of an asset to either stagnate or decrease slightly.
Although BTC lingers in this phase, Baro added, “Bitcoin is still moving within a local uptrend.” However, “the danger of falling to $24,500-25,000 remains within the bearish H&S pattern.”
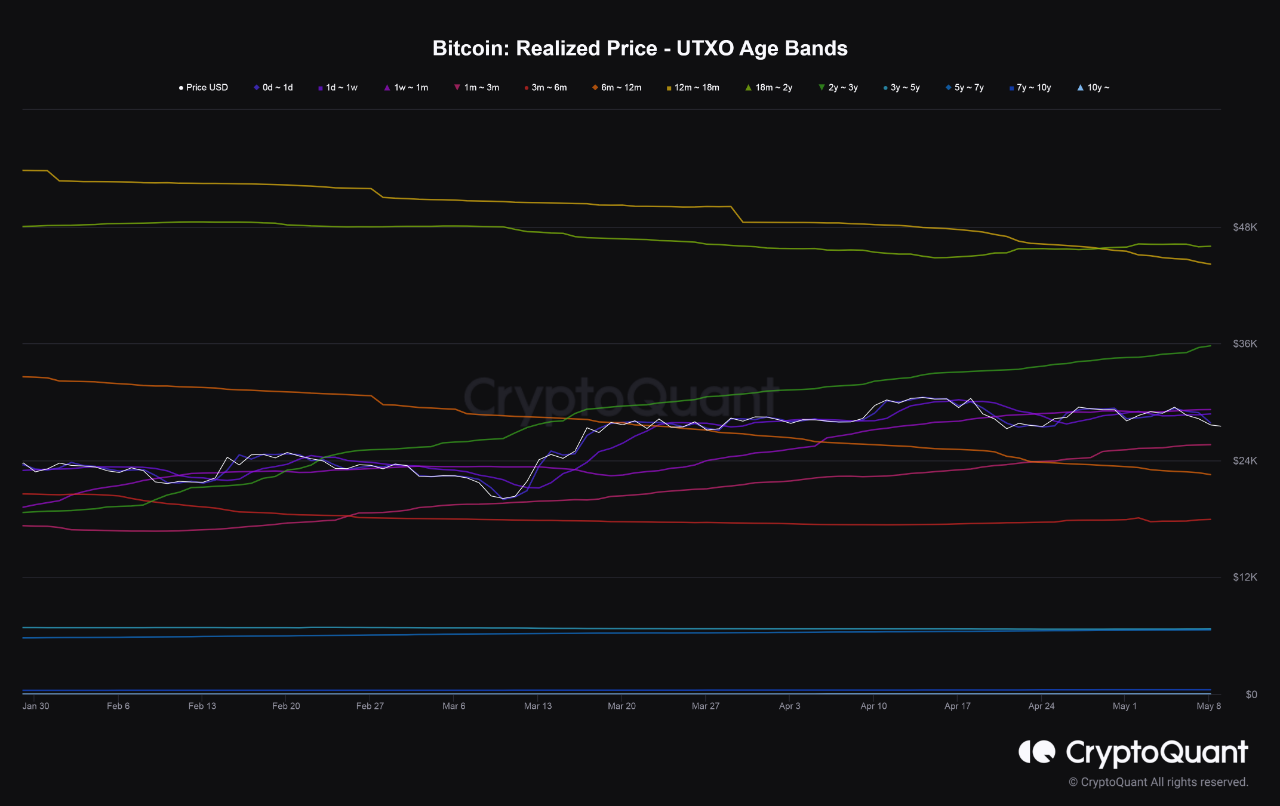
Sharing the same opinion, another pseudonymous CryptoQuant analyst Abramchart noted that a new support area had been identified following BTC’s fall from the $30,000 price mark. According to Abramchart,
“After the recent drop in Bitcoin, we can identify the next support areas through the Realized Price – UTXO Age Bands indicator, which helps us to understand the holding behavior of each group by comparing a set of different realized prices. The closest support area is at 25619, which represents the average purchase price of wallets that bought Bitcoin within the last 3-6 months.”
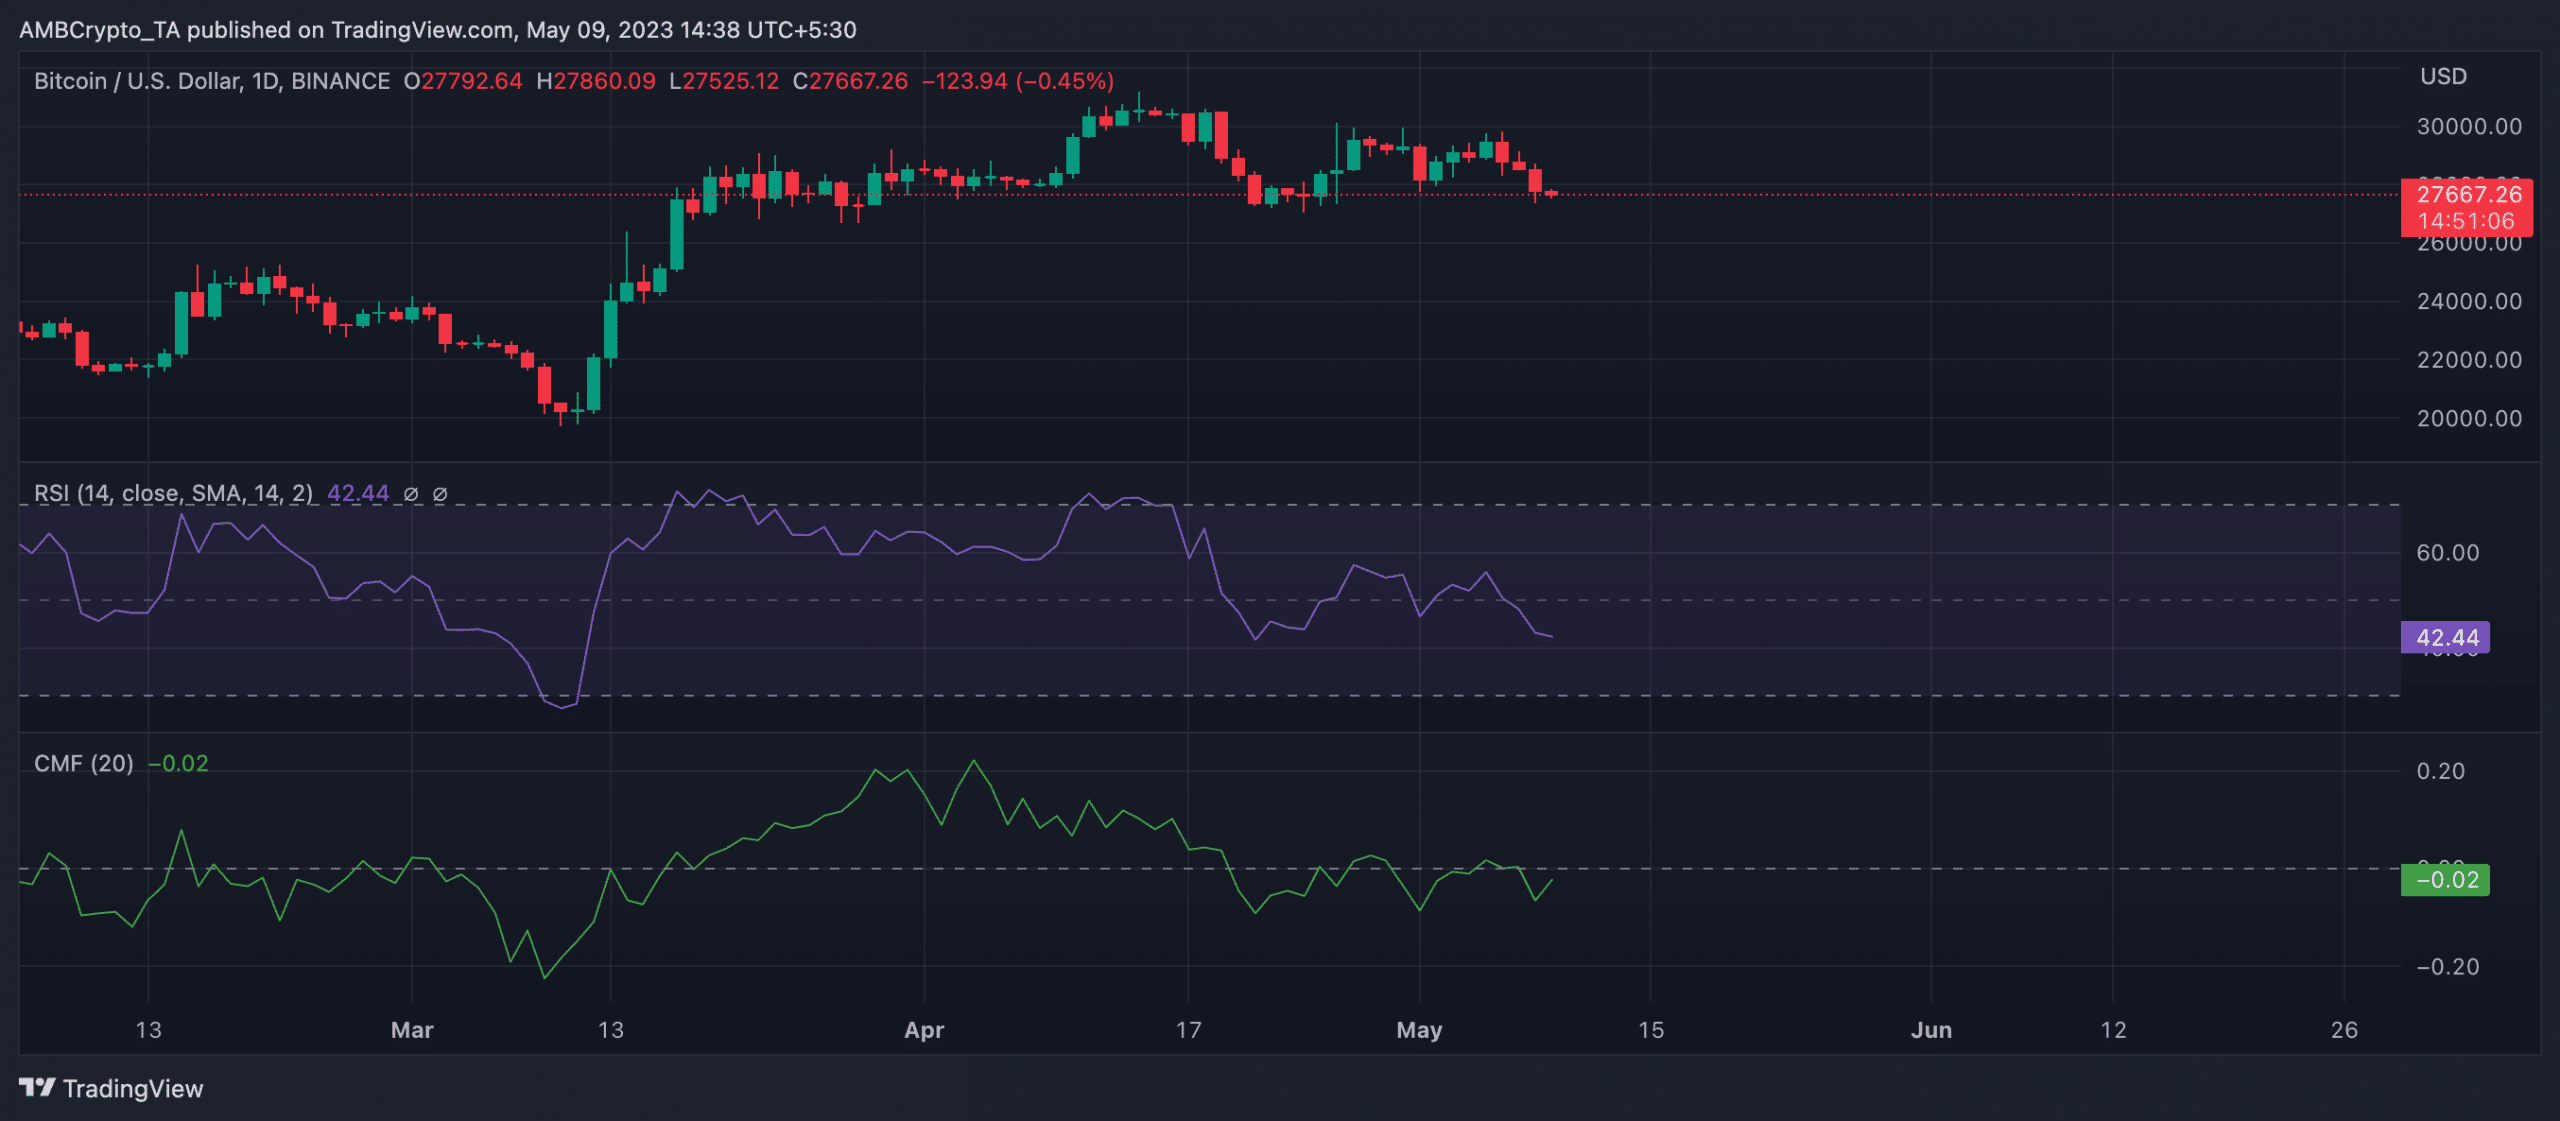
The numbers on a daily chart
At press time, BTC exchanged hands at $27,579.73. After the coin’s price peaked at $30,967 on 14 April, it has since dropped by 11%.
On a daily chart, the coin’s momentum indicator Relative Strength Index (RSI) rested below its 50-neutral spot at 42.44. In a downtrend at the time of writing, selling pressure exceeded accumulation.
Also, the coin’s Chaikin Money Flow (CMF) was spotted below its centerline at -0.02. When an asset’s CMF returns a negative value, it means that the selling pressure is higher than the buying pressure.
It also suggests that the asset’s money flow volume is decreasing, and is often followed by a price decline.