


Disclaimer: The information presented does not constitute financial, investment, trading, or other types of advice and is solely the writer’s opinion.
alt HD: Bitcoin witnesses HTF accumulation but short-term bearish pressure, what could transpire next this month?
- Bitcoin’s rejection at $28.5k saw it slump below the $27k support
- The short-term lack of demand could see losses spiral further
Bitcoin’s [BTC] fall below the $27k mark on 11 October did not faze the bulls. Instead, a large number of traders opted to go long in a bold show of conviction. The leverage ratio of the king coin also saw an increase over the past few days.
Read Bitcoin’s [BTC] Price Prediction 2023-24
A recent price report of Bitcoin from AMBCrypto highlighted the importance of the $27k level as well as the impact that the September CPI data could have. The support level was lost in the past 24 hours, and leveraged traders can not dig BTC out of this bearish pit by themselves.
A drop to the range lows could present a buying opportunity
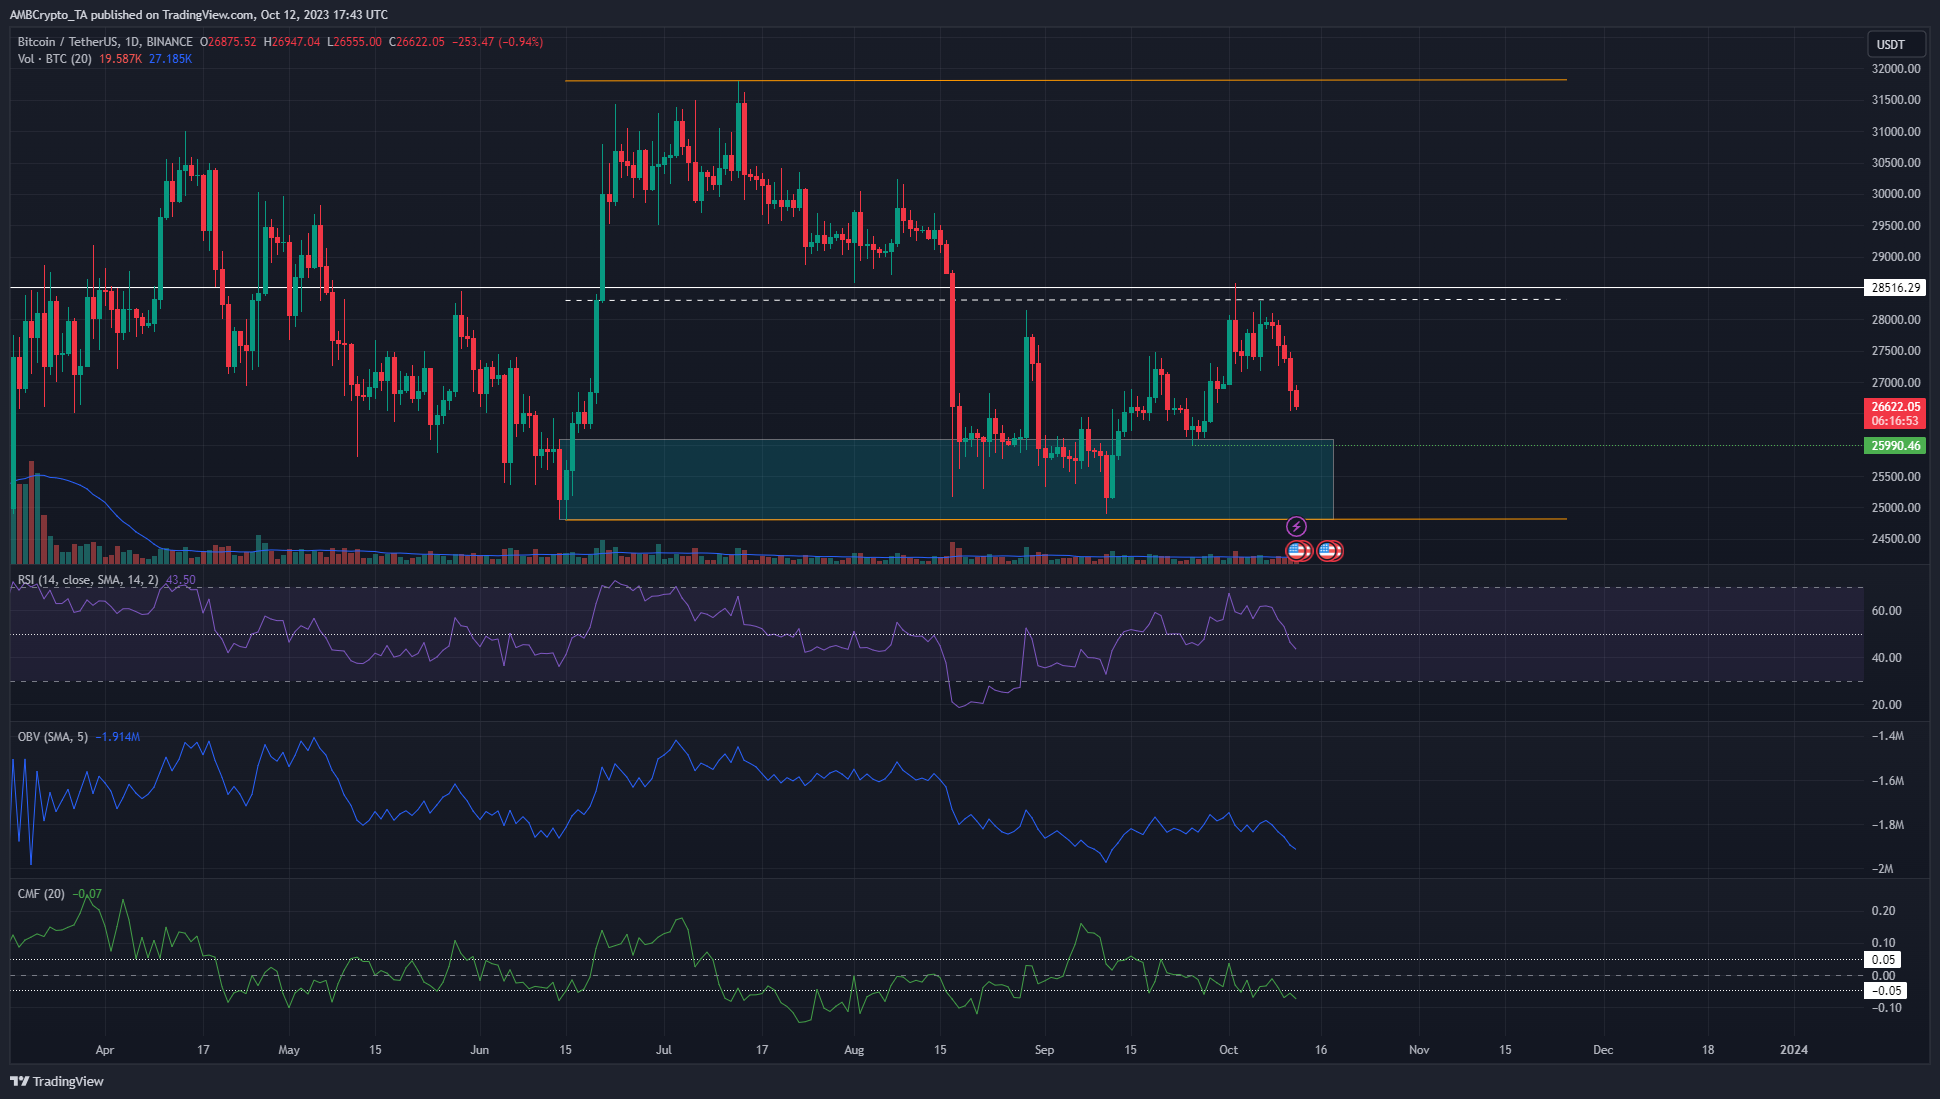
The daily timeframe chart showed BTC has a bullish structure, with the recent higher low at $25,990. A session close below that mark would shift the structure, but the presence of the bullish order block and the range low could see Bitcoin recover.
Yet, at the time of writing, more losses looked likely. The lower timeframes showed strong bearish momentum. Even on the one-day chart, the Relative Strength Index (RSI) slipped below neutral 50 to signal that a shift had occurred. The Chaikin Money Flow (CMF) was below -0.05, reflecting significant capital outflow from the market. The On-Balance Volume (OBV) saw a bounce in September but has trended lower over the past week.
Therefore, a move to the $24.8k-$25.8k region could present an ideal buying opportunity. The invalidation would be close by, around $24.6k or slightly lower. Take-profit targets include the mid-range mark at $28.5k.
On-chain metrics point toward a phase of accumulation from late July
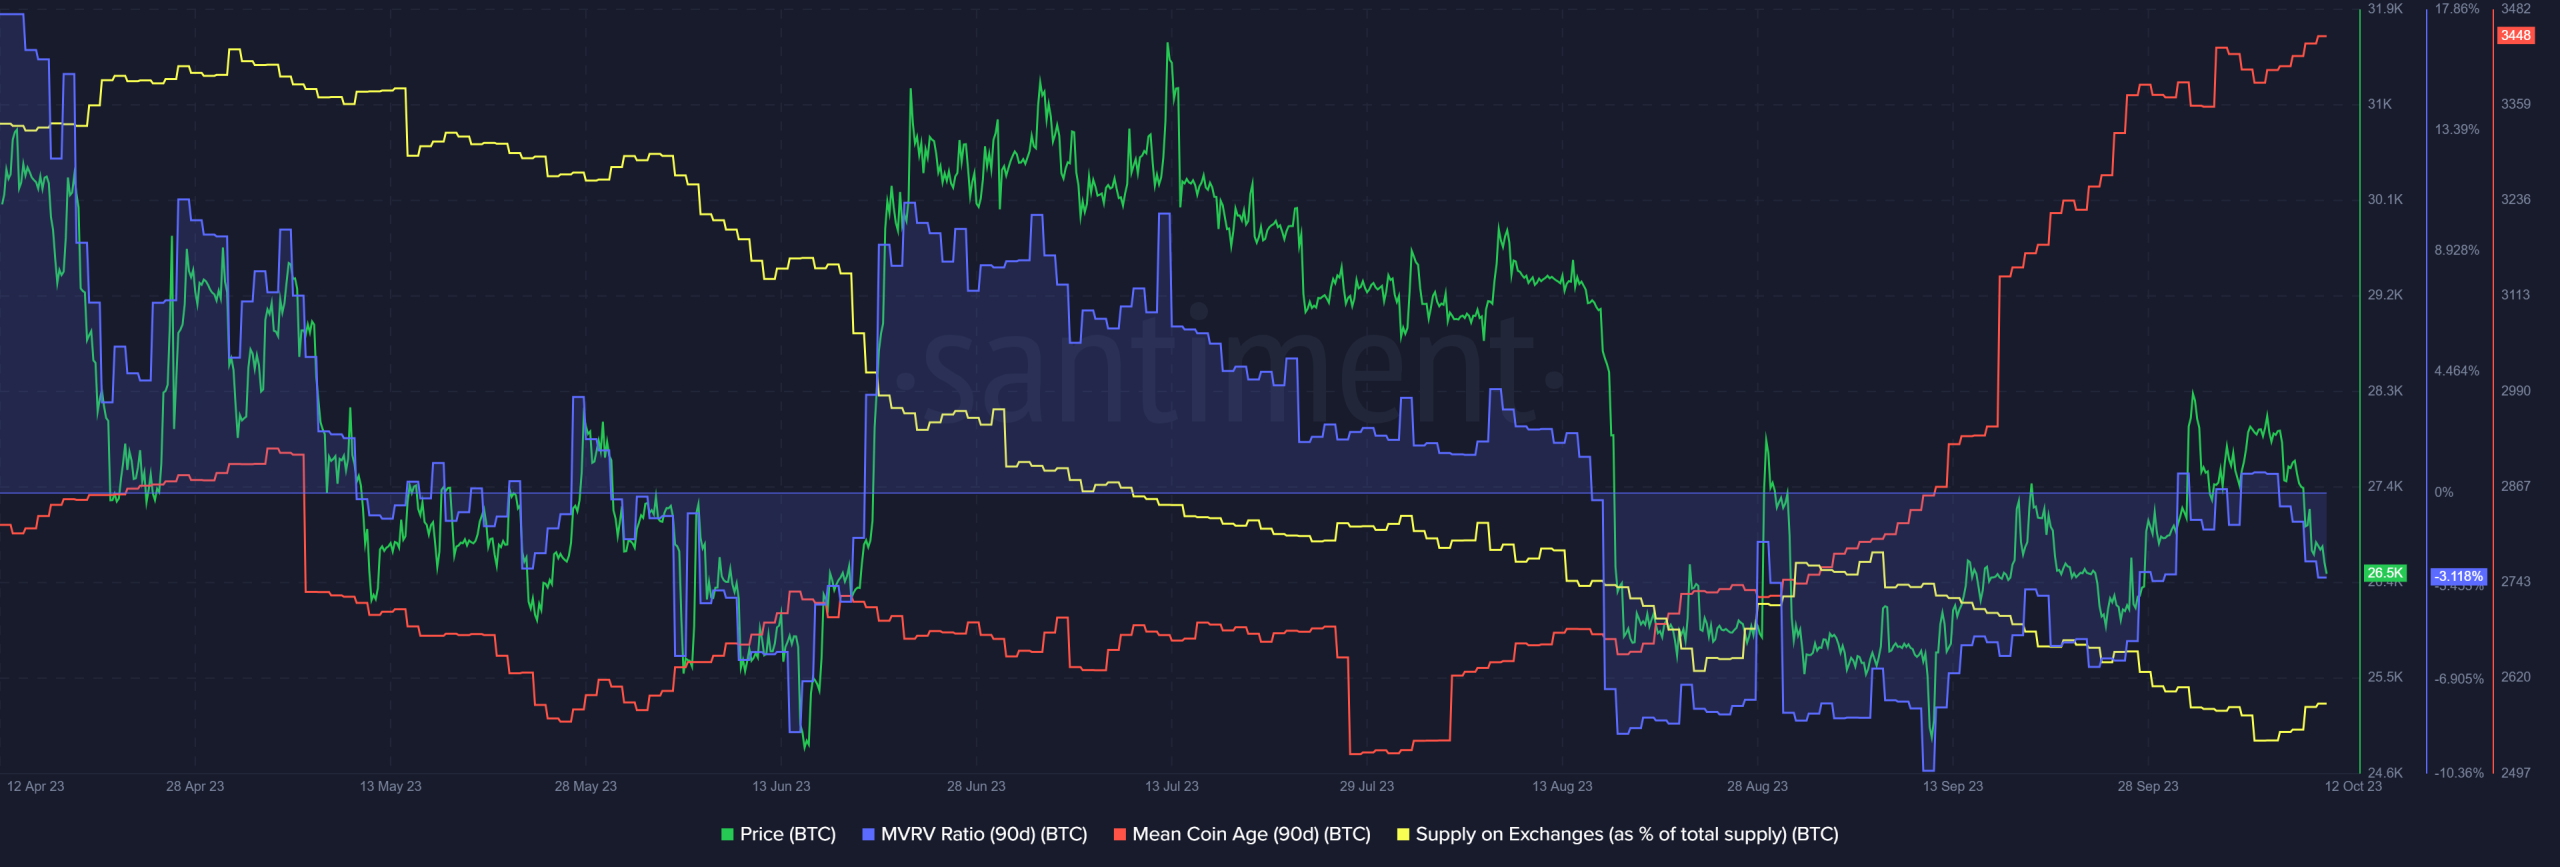
The Mean Coin Age of BTC has been in a strong uptrend since July, showing that holders refused to move their coins. The supply on exchanges was also in a steady decline. Both metrics reflect accumulation. The Market Value to Realized Value (MVRV) ratio pointed toward a slightly undervalued asset.

Yet in the short-term the market sentiment was bearish. The Open Interest (OI) saw an increase in the number of short-sellers on 11 October. While the OI has been relatively flat as the price trended lower, the spot Cumulative Volume Delta (CVD) wasn’t.
How much are 1, 10, or 100 BTC worth today?
The CVD highlighted that selling volume was dominant over the past week. If this indicator doesn’t change its trajectory, a recovery might not be on track. Lower timeframe traders can use a bounce in prices but a weak CVD to look for scalp shorting opportunities.