![Will Chainlink's [LINK] retest flip support into resistance?](https://ambcrypto.com/wp-content/uploads/2025/04/Renuka-57-1200x675.webp)
- LINK’s retest of its $12.5 breakout zone hinted at a possible bearish continuation
- On-chain and liquidation data supported further downside potential towards the $10 and $7.5 levels
After a week of consistent decline, Chainlink [LINK] has been testing a key resistance zone around $12.5 — A level that previously acted as a key support. The altcoin’s price action appeared to be a retest of the breakout zone that might now flip into resistance. In fact, it also alluded to a lack of conviction on the bullish side.
However, LINK may see a more significant pullback if the bulls do not maintain this critical price level. The broader market remains indecisive and Chainlink (LINK)’s recent retracement has been within expectations.

Source: TradingView
Additionally, the price has not managed to post a higher high after topping near $16.
Retesting the descending trendline at around $12.5 without bouncing convincingly is a sign of a weakening structure.
LINK’s bearish setup bolstered by on-chain data
At the time of writing, on-chain data seemed to give little reassurance to LINK’s bulls.
According to CryptoQuant, the net deposits for the altcoin on exchanges are only slightly above their 7-day average. That is usually a sign of heightened selling pressure.
Higher net deposits generally represent investors pulling funds from decentralized exchanges and sending them over to centralized exchanges with a view to sell.
Now, although the uptick did not exceed the limits, it did coincide with a bearish technical outlook. This convergence may justify LINK’s bearish bias on the charts.
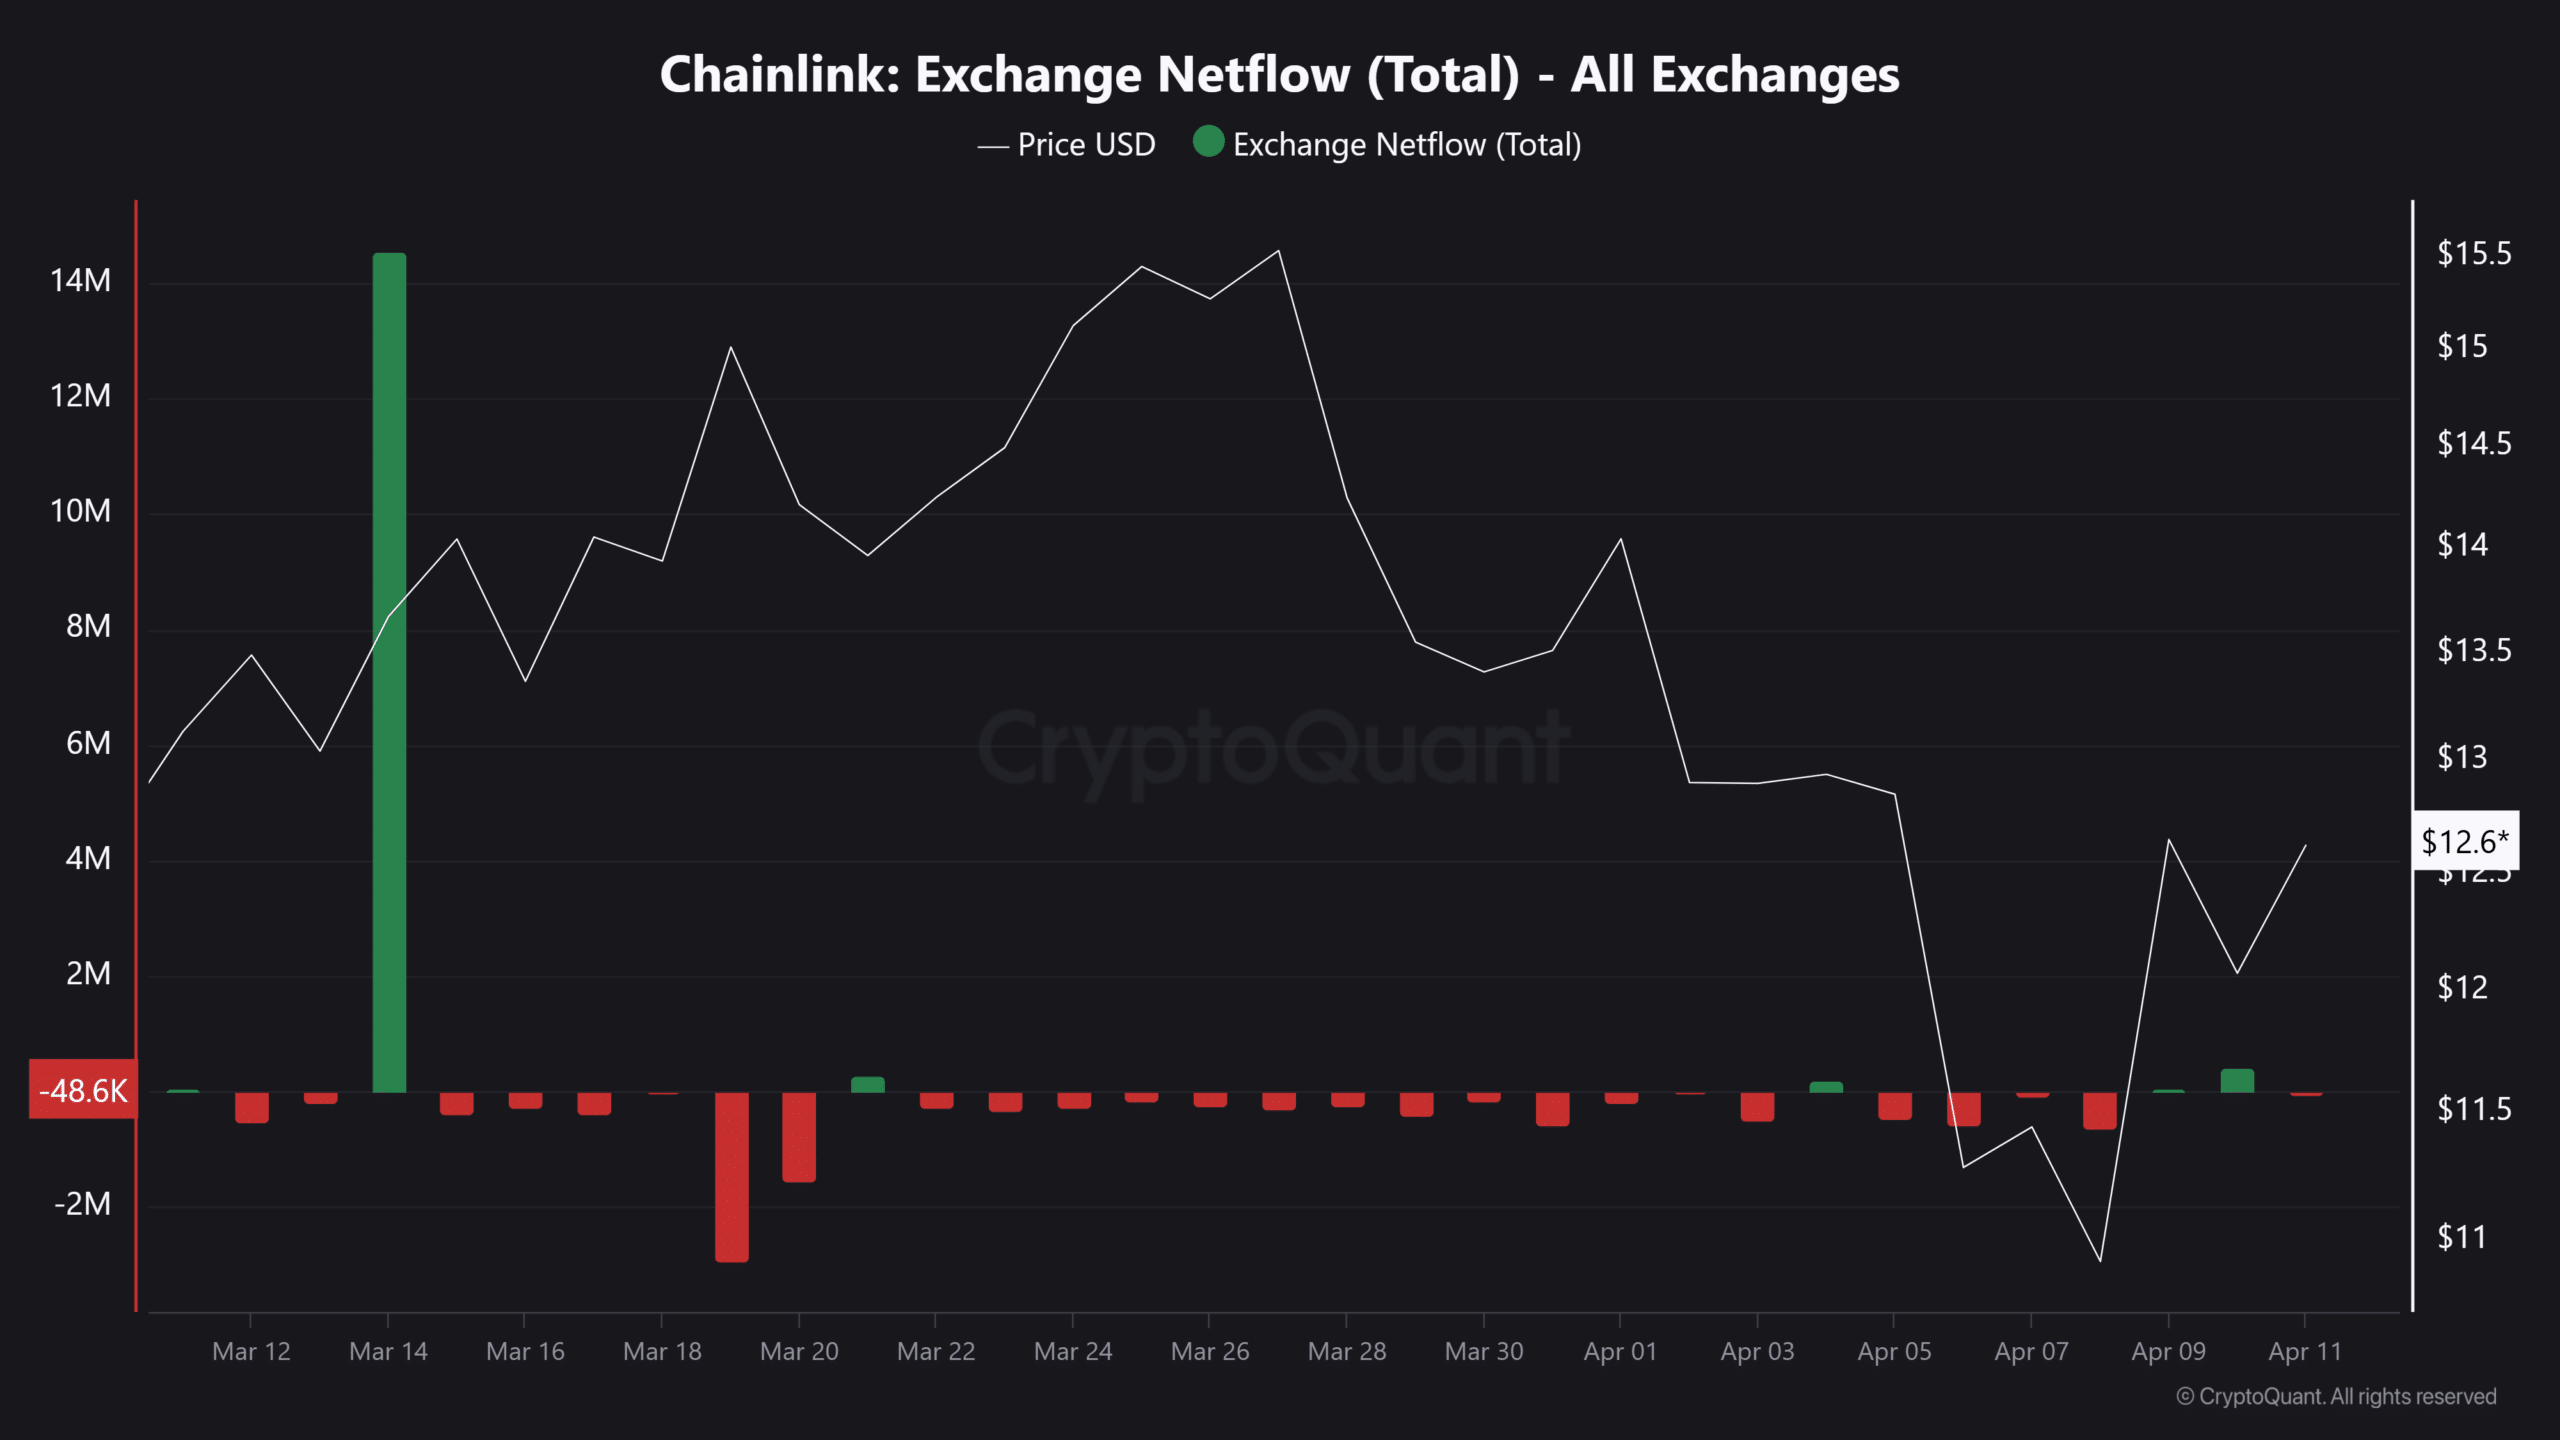
Source: CryptoQuant
Liquidation clusters hint a further drop past $10
Finally, leveraged traders may further influence LINK’s price trajectory.
Liquidation heatmaps also revealed a cluster of long liquidation levels near the $10-mark. Market makers like to hunt these liquidity zones during periods of uncertainty.

Source: CoinGlass
If LINK moves towards $10, triggering liquidations, that selling pressure could trigger a cascade of events. Then, another push to $7.5 — Q4 2023’s previous high — would become probable.
The $12.5 zone must hold to avoid deeper losses. With elevated exchange deposits and visible liquidation pools below, the path of least resistance is south for now.