Will Ethereum Classic’s support level finally cave?
Ethereum Classic has hovered over a key support level but weak buying pressure could trigger a bearish breakout.

Disclaimer: The information presented does not constitute financial, investment, trading, or other types of advice and is solely the writer’s opinion.
Ethereum Classic [ETC] has been on a bearish decline since 14 April after price was rejected at the $23 resistance level. This has seen the altcoin lose over 22% of its value.
With Bitcoin [BTC] posting losses of 1.4% in the past 24 hours to trade at $26.7k, ETC bears could force a breakout of the compact range.
Bollinger Bands hinted at a sharp move for ETC
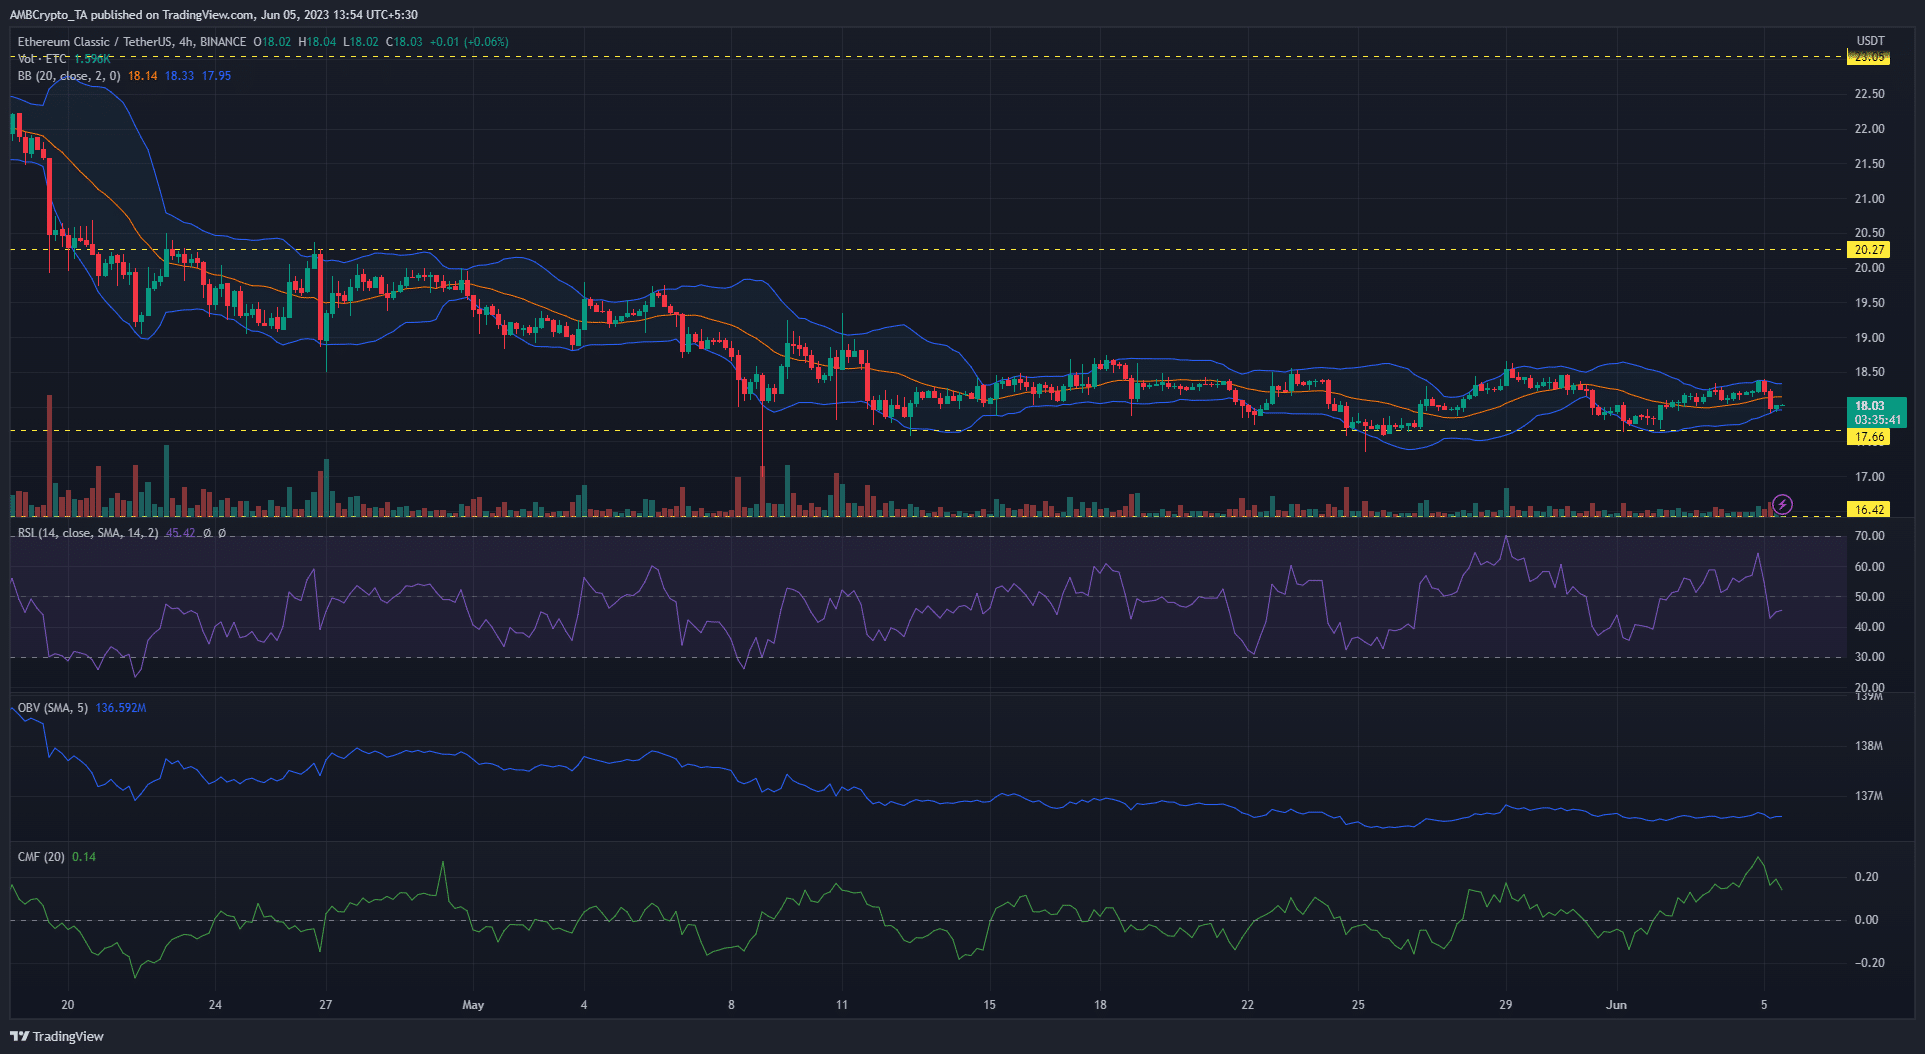
Ethereum Classic has traded sideways since 15 May, oscillating between the upper and lower Bollinger bands. With price consolidating just above the critical support level of $17.66, the compression of the Bollinger Bands suggested a breakout was imminent.
The key support level of $17.66 has been tested thrice over the past two weeks on the four-hour timeframe. This hinted at weakening buying pressure at that level. A further retest of this level could see price break the support, with bears targeting the March low of $16.42.
Bulls could once again defend the level and look to rally. However, an impending factor could be ETC’s low trading volume.
The RSI dipped under the neutral 50 and stood at 45, as of press time. This hinted at waning bullish action. The OBV’s fluctuating movement re-echoed the lack of certainty between buyers and sellers.
However, the CMF remained above the zero mark with a reading of +0.13. This suggested that capital inflows still existed that could spur a bullish rally.
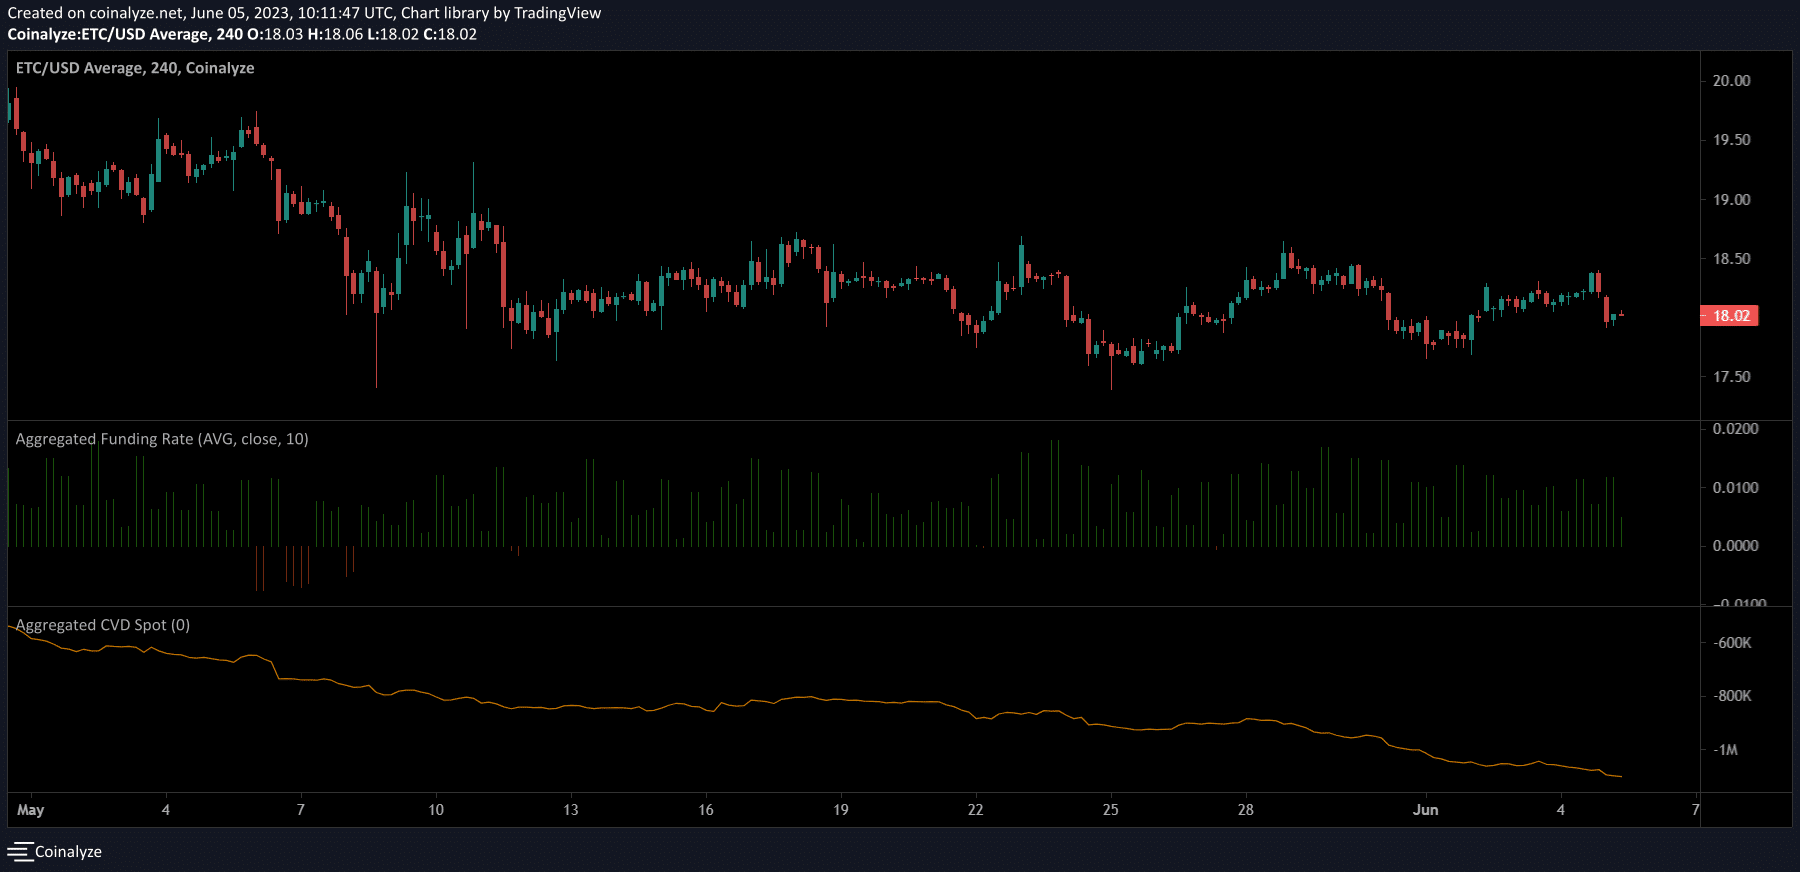
Mixed signals in futures market
Read Ethereum Classic’s [ETC] Price Prediction 2023-24
The four-hour chart on Coinalyze showed the spot CVD in a steady decline. This revealed the intense selling pressure over the past month and hinted at the bearish momentum still prevalent in the market.
However, the funding rate was positive and pointed toward bullish leanings. Although the bias wasn’t overly strong on the higher timeframes, it hinted at an opportunity for bulls to rally, if Ethereum Classic’s volume ramps up over the coming days.


