
- ETH briefly broke support and traded at a low of $2852 on the 1st of May.
- Its Futures Open Interest declined considerably since the 10th of April.
Ethereum [ETH] recently crossed below its 20-day simple moving average (SMA), putting it at risk of a further decline in the short term.
When an asset’s price falls below its 20-day SMA, it suggests that the short-term trend for the asset is downward.
Market participants often view this as a sign that sellers are in control and that the asset’s price will likely continue declining.
Readings from ETH’s price movement on a 1-day chart showed that its price fell below its 20-day SMA on the 30th of April.
As coin selloffs intensified, ETH broke support and closed the trading session on the 1st of May at a low of $2850.
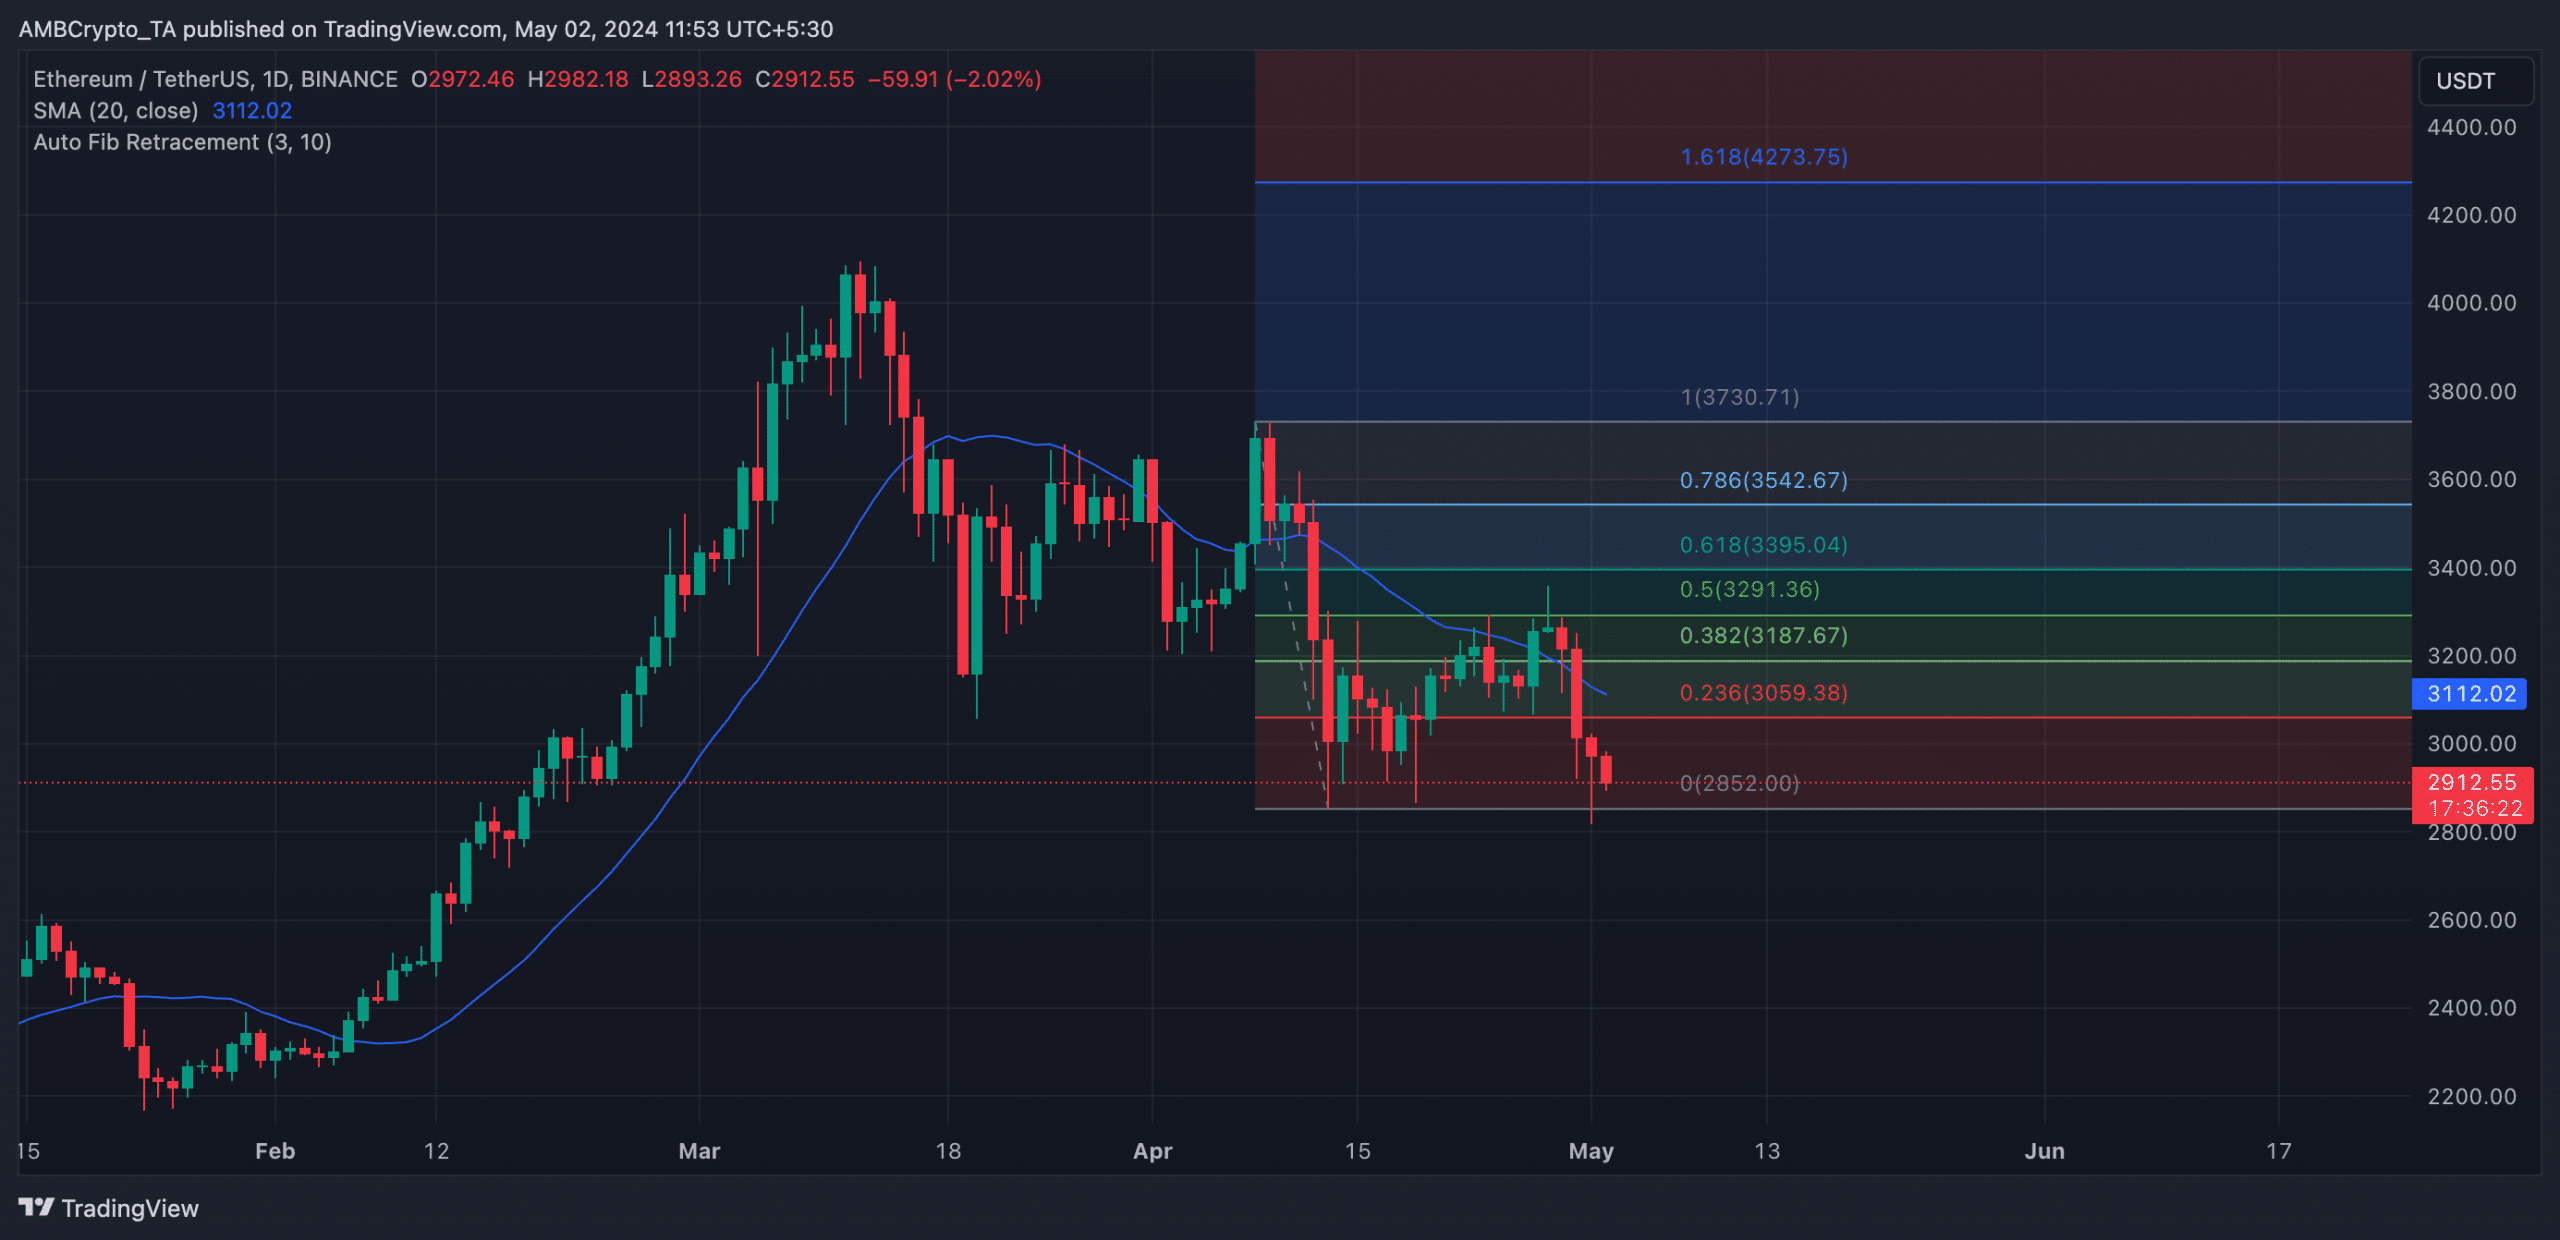
Source: ETH/USDT on TradingView
Bulls are nowhere to be found
Although the coin’s price retraced in the last 24 hours to exchange hands at $2,913 at the time of press, bullish pressure remains too weak to sustain any significant rally in the short term.
AMBCrypto found that on the 1st of May, ETH’s MACD line (blue) intersected its signal line (orange) in a downtrend when the coin’s fell broke below support.
This intersection is a bearish sign. Both lines below the zero line, when it occurred, confirmed the existing downtrend and signaled the possibility of a further decline in ETH’s price.
Also confirming the strength of the current market downtrend, ETH’s Aroon Down Line (blue) was 92.86% as of this writing.
This indicator identifies an asset’s trend strength and potential trend reversal points in its price movement.
When the Aroon Down line is close to 100, it indicates that the downtrend is strong and that the most recent low was reached relatively recently.
Further, ETH’s key momentum indicators pointed to a significant decline in demand for the altcoin. Its Relative Strength Index (RSI) was 36.46, while its Money Flow Index (MFI) was 33.96.
The values of these indicators showed that market participants favored ETH distribution over the accumulation of newer coins.
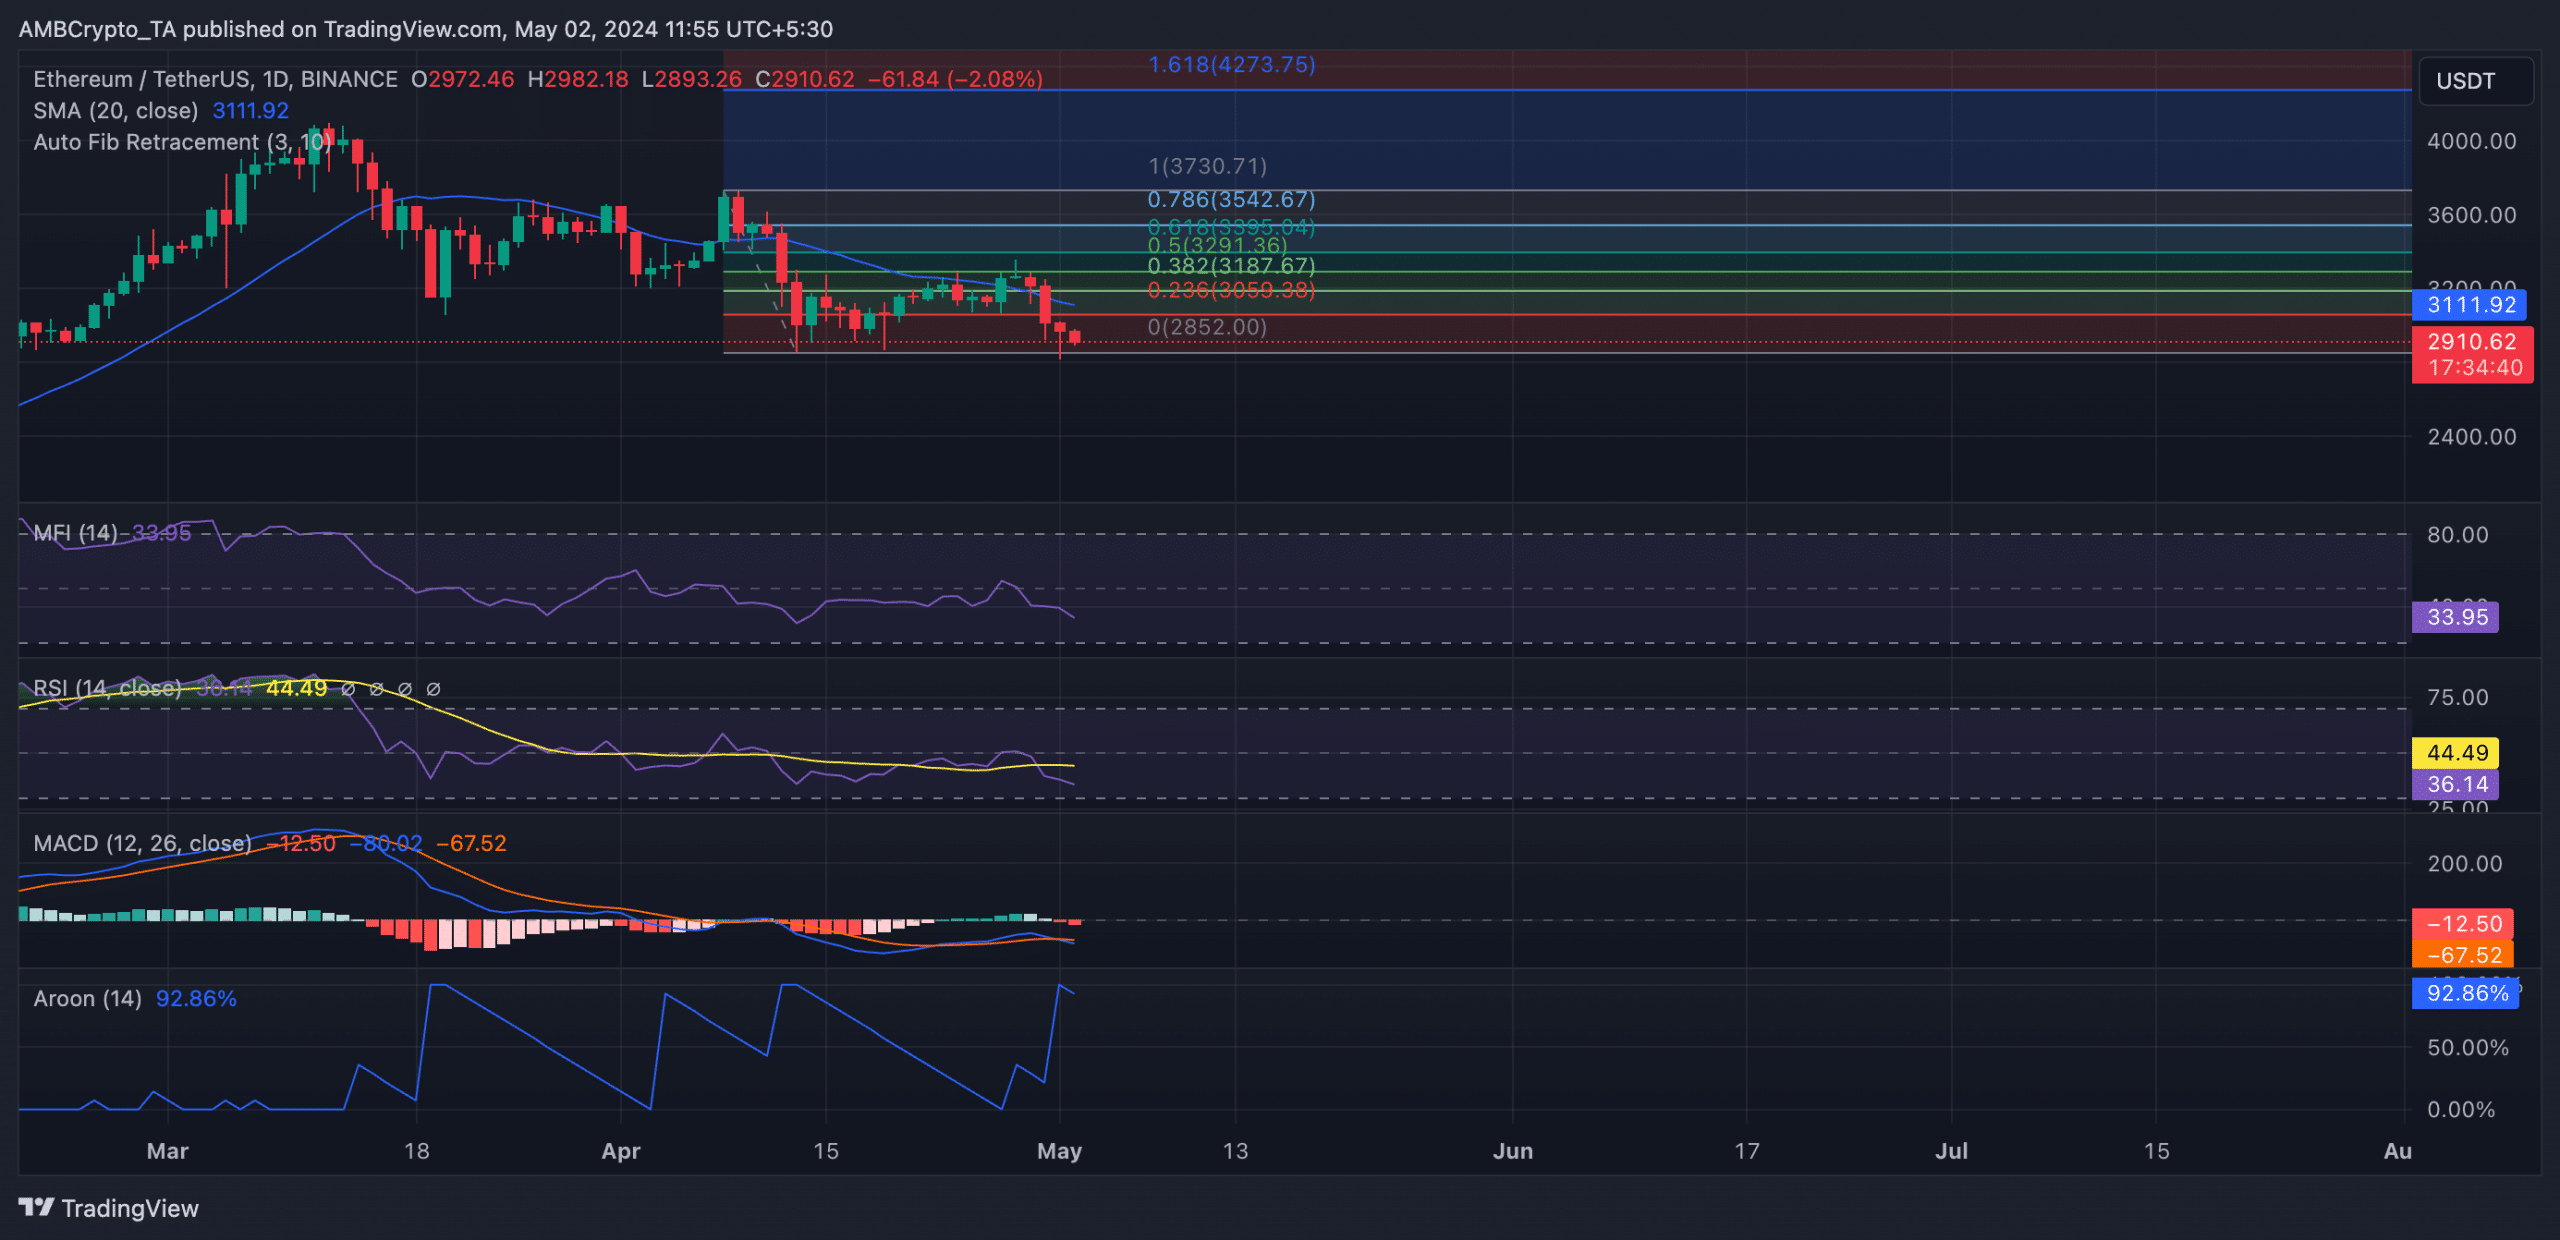
Source: ETH/USDT on TradingView
AMBCrypto’s assessment of ETH’s network activity using a 30-day average confirmed the decline in demand for the altcoin in the last month.
Read Ethereum’s [ETH] Price Prediction 2024-25
According to Santiment’s data, the daily count of addresses involved in at least one ETH trade in the last month has dropped by 7%.
Similarly, the number of new addresses created to ETH has decreased in the last month. On-chain data showed that this has fallen by 10% in the past 30 days.
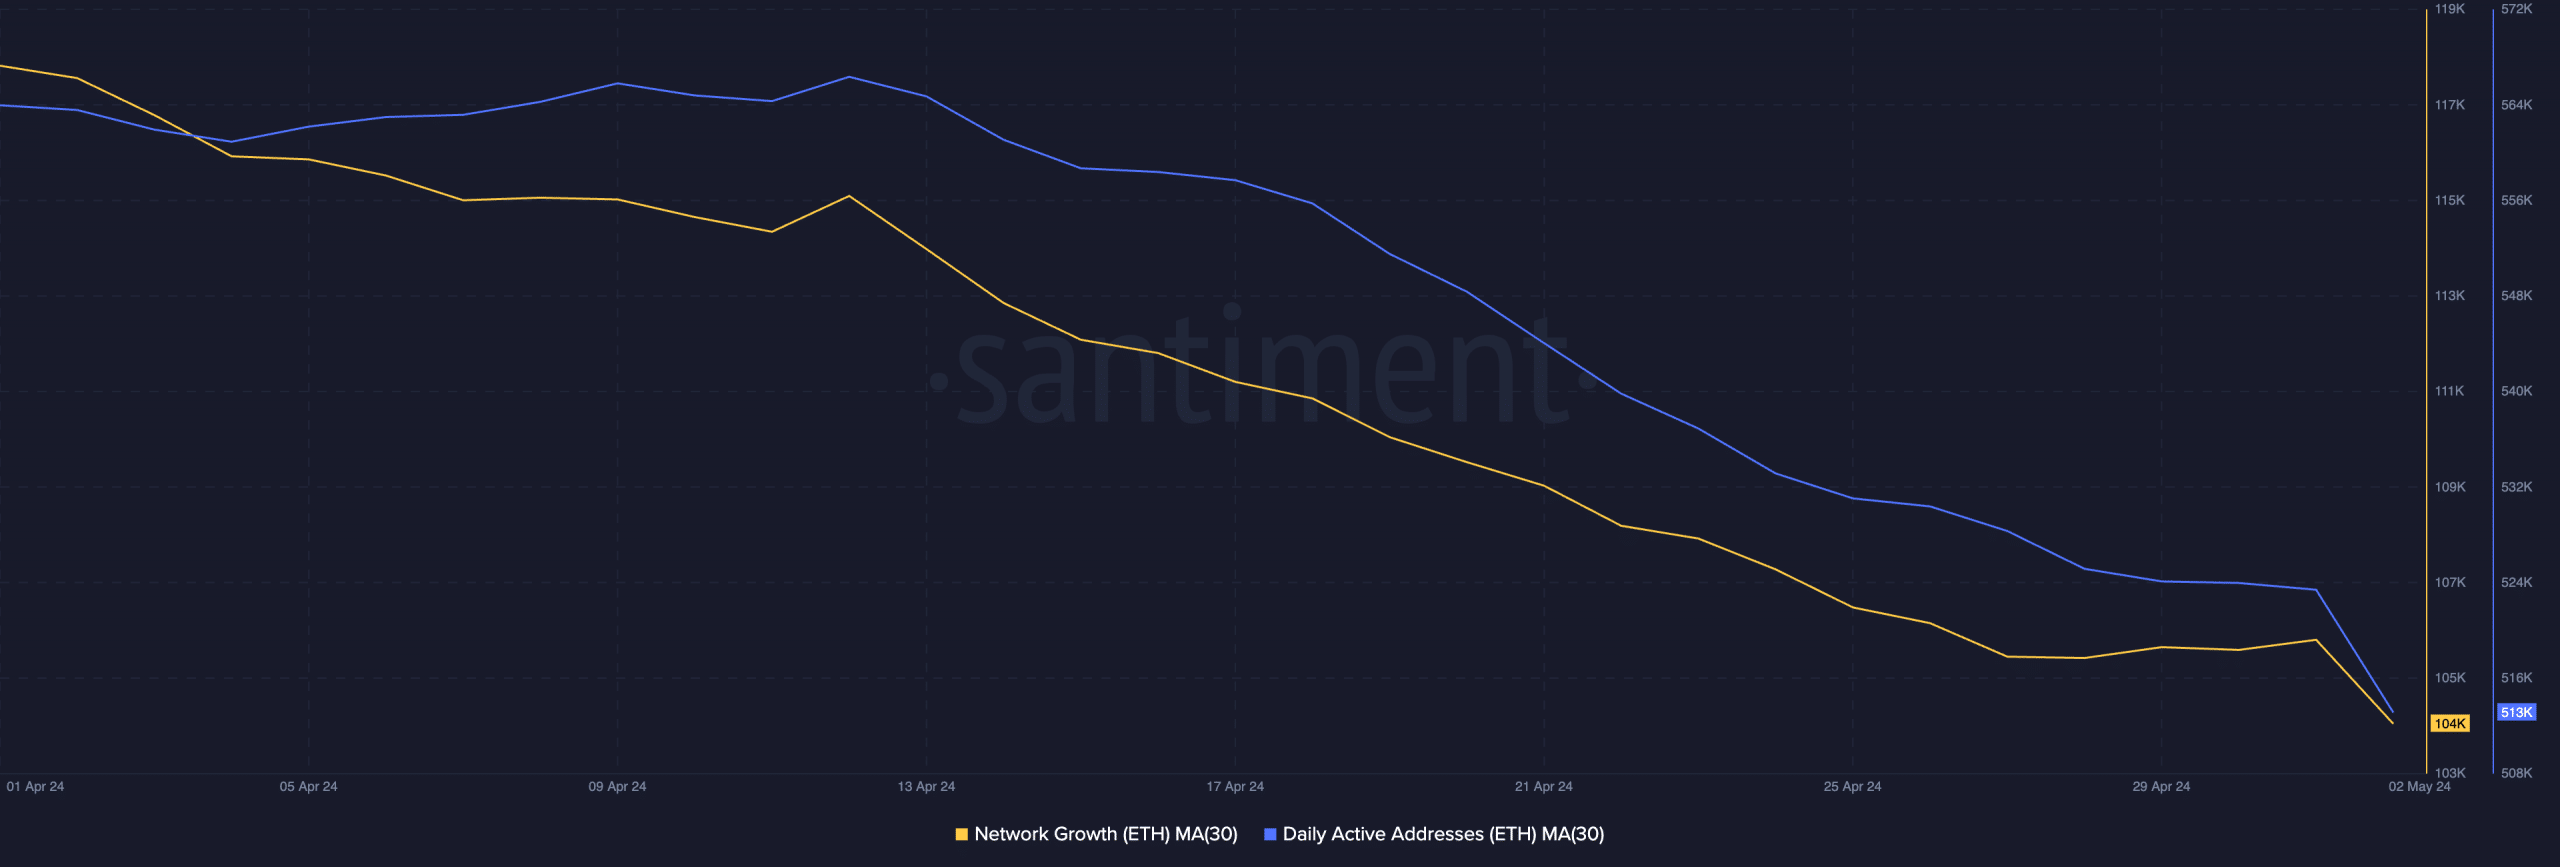
Source: Santiment