Will Ethereum follow the bullish patterns of 2016, 2019?

- Ethereum has a similar risk metric as of 2016 and 2019.
- ETH’s fear meets the Ethervista mania.
Ethereum [ETH] remained a significant force in the crypto market, despite the recent downturn that suggests prices might consolidate or continue to decline throughout September.
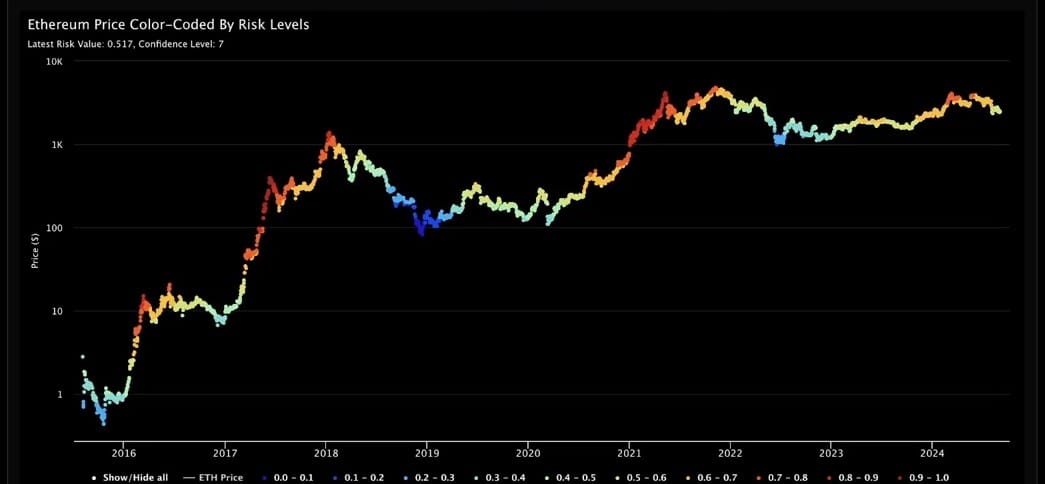
According to Benjamin Cowen, a well-known technical analyst, Ethereum’s current risk metric indicates a pattern similar to those seen in 2016 and 2019.
Back then, the metric reading was at 0.5, just like now. During those years, Ethereum’s price initially rose slightly before a decline that led to a bull market.
Cowen suggests that ETH might be poised for a similar move this year, leading to a potential bull run in the fourth quarter. However, whether the Ethereum price action will align with this prediction remains to be seen.
ETH trades in massive triangle
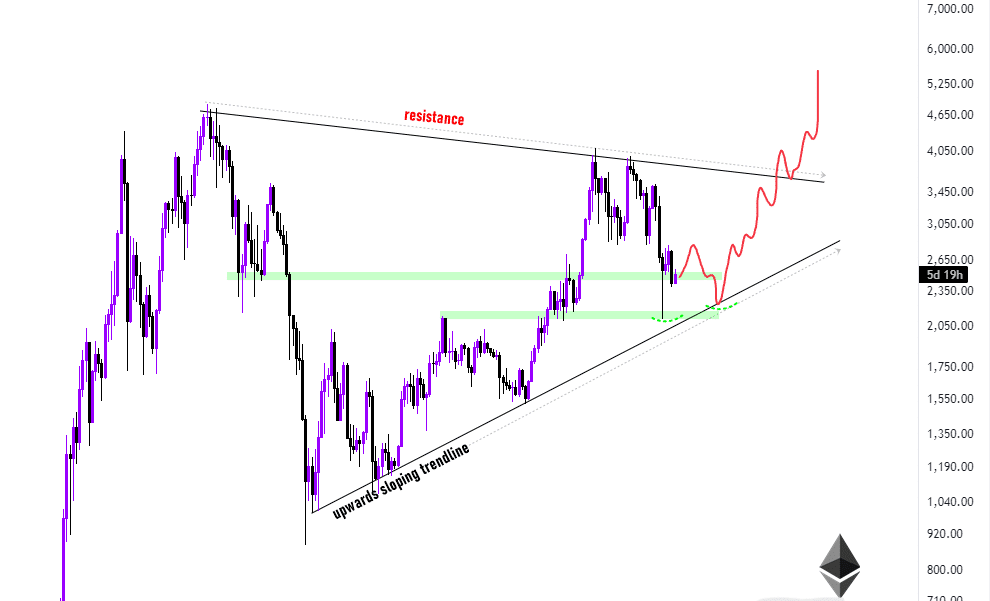
ETH/USDT’s press time price movement was trading within a massive triangle pattern on the weekly timeframe.
Historically, in 2016 and 2019, after a brief price increase, ETH found support and then surged into a bull market.
The current red weekly candle may indicate that Ethereum is about to enter the second phase of this pattern—a decline to find support.
If ETH forms a double bottom near the upward sloping trendline support, it could signal the beginning of a price surge.
The stochastic RSI on the weekly timeframe is also oversold, suggesting that while the price may continue to fall in the short term, a reversal could be imminent.
If the upward sloping trendline support breaks, it may be wise to cut losses and wait for a better entry point for long-term investment in Ethereum.
Short-term traders might consider short-selling after the support break, although this contradicts the long-term bullish outlook for ETH.
Fear and greed index
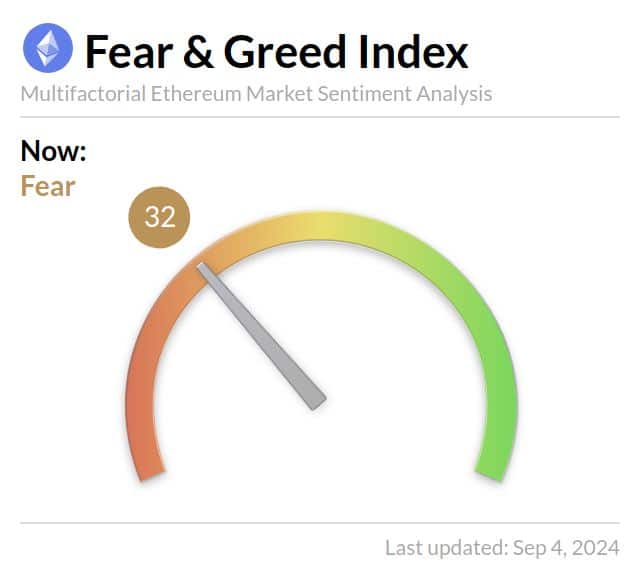
Further analysis shows that the Fear and Greed Index is currently at 32, with the price of Ethereum around $2,424 at press time. This represents a shift from extreme fear earlier in August, indicating growing optimism.
Markets often reverse during extreme readings on the Fear and Greed Index, suggesting that the ETH price could stabilize near current levels until the broader market settles.
The alignment of the risk metric with past patterns further supports the possibility of Ethereum following a similar trajectory as in 2016 and 2019.
Ethervista mania
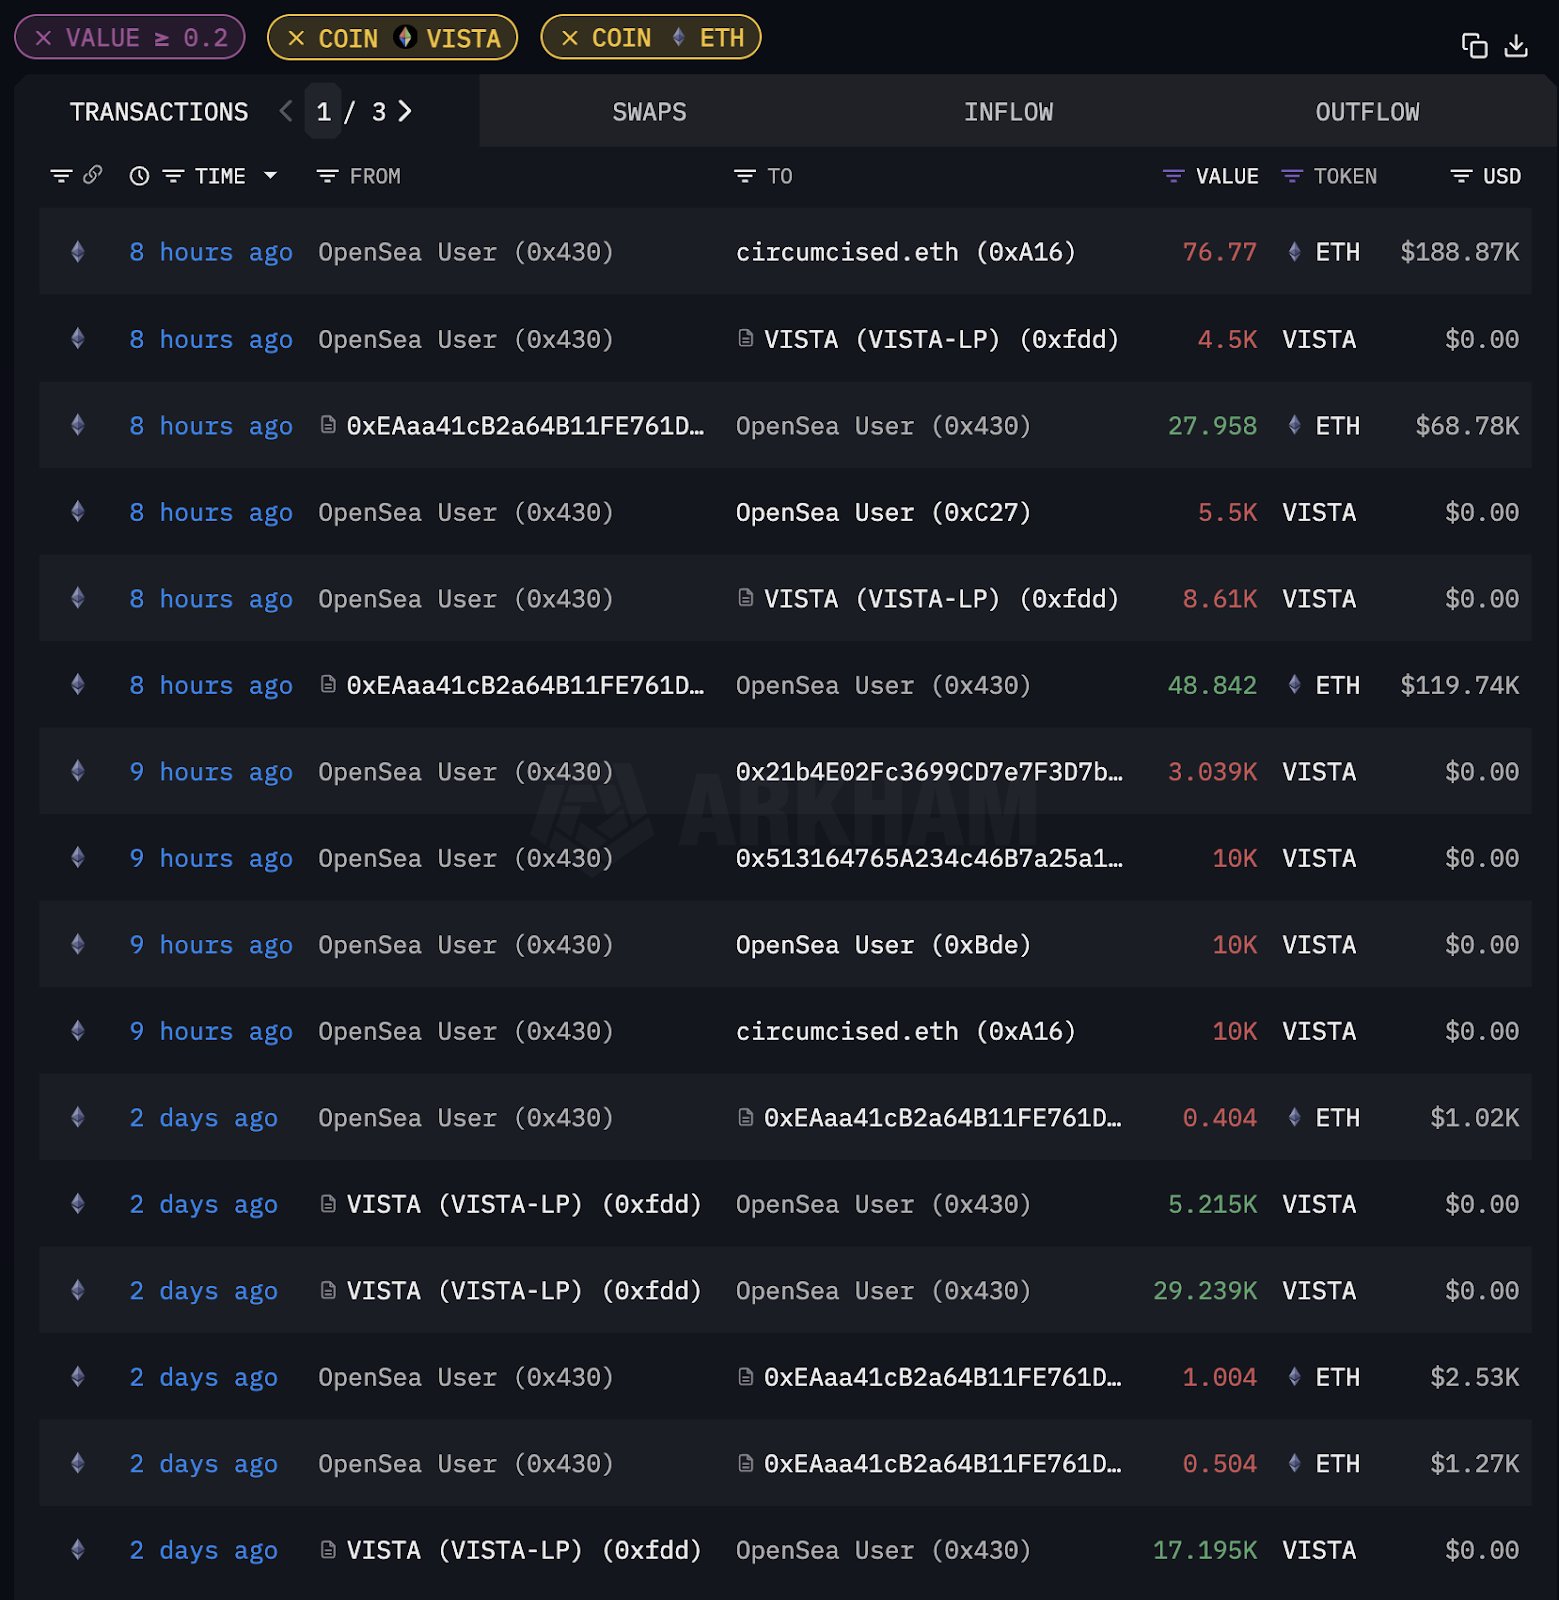
The recent launch of Ethervista, akin to Solana’s Pump.Fun, has generated considerable excitement within the Ethereum community. A savvy trader turned $5,000 into $670,000 within 48 hours of Ethervista’s launch.
By securing over 5% of the token supply and strategically distributing it across multiple wallets, the trader realized a profit of over 130x, all converted into ETH.
However, it is still unclear if Ethervista will have the same impact on Ethereum’s price as Pump.Fun has had on Solana, where increased volume and activity have not led to price gains.
Penpie losses $27M ETH to hacking
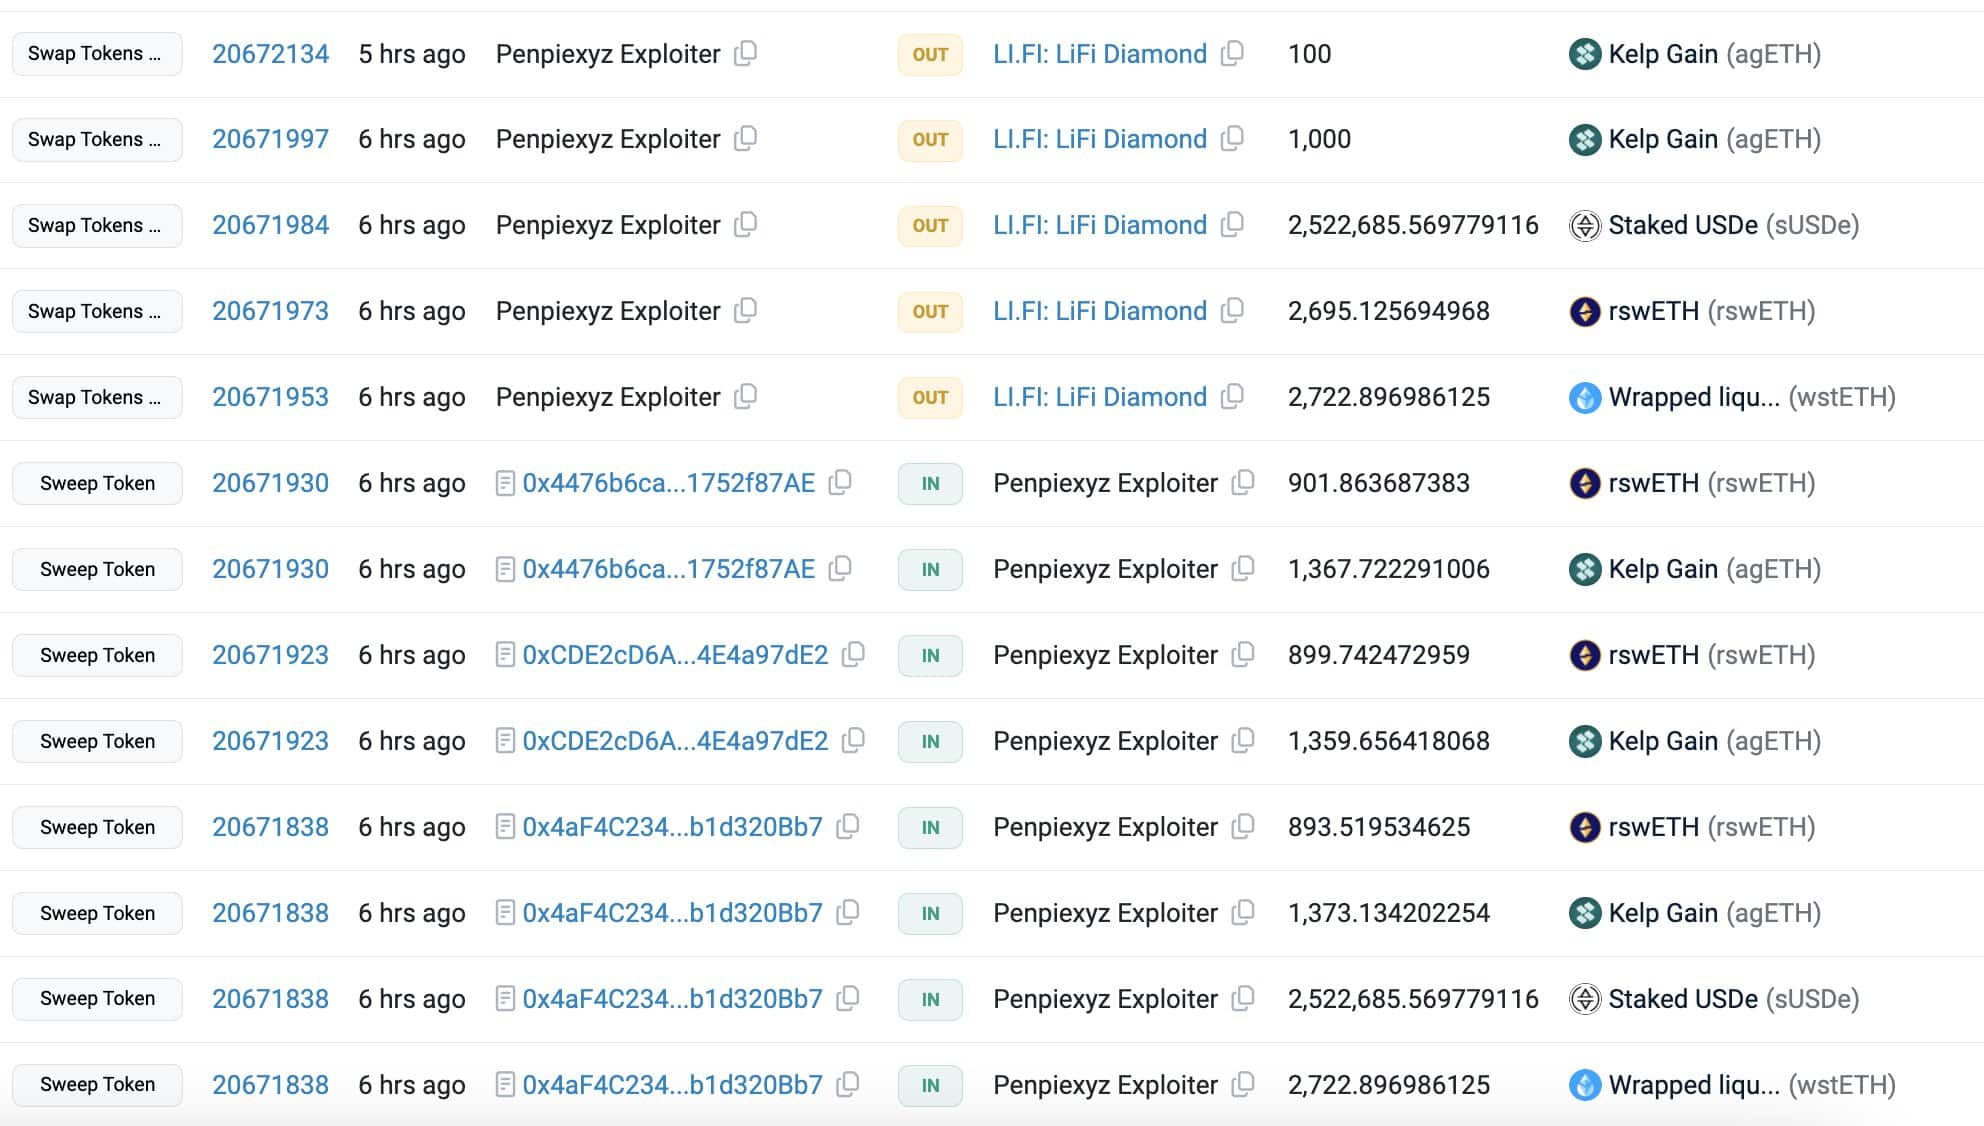
On a different note, Penpie recently suffered a significant loss of $27.3 million, including various forms of Ethereum such as rswETH, agETH, and wstETH as per Lookonchain.
Read Ethereum’s [ETH] Price Prediction 2024–2025
The hacker converted the assets into 11,109 ETH and deposited 1,000 ETH into Tornado Cash.
This breach adds another layer of complexity to Ethereum’s market outlook as it continues to navigate both technical challenges and market dynamics.

