
- The Ethereum weekly close above $2,496 would be an encouraging sight.
- The long-term downtrend meant a price recovery could be delayed by holders seeking to exit at break-even.
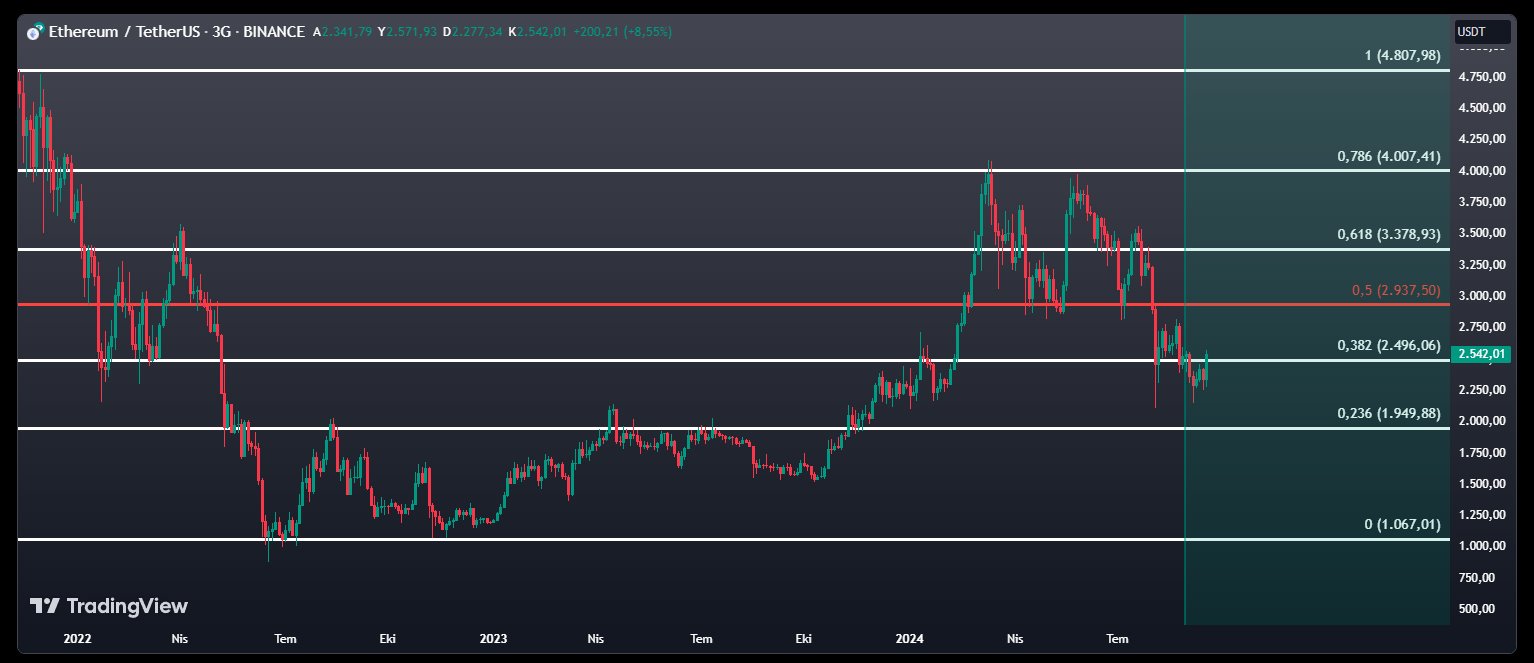
Ethereum [ETH] prices rose above the $2,500 mark but the downtrend of the past two months was still in play. The longer timeframes showed that $1,949 and $2,496 were the key levels to watch.
Source: Burak Kesmeci on X
CryptoQuant analyst Burak Kesmeci pointed out in a post on X that a weekly close above $2,496 would be a positive for ETH bulls. The levels on the chart above were plotted based on Ethereum’s downtrend from $4,807 to $1,067 which began in November 2021.
The TD Sequential also presented a buy signal for ETH, AMBCrypto looked at other metrics for Ethereum, and not all of them were as encouraging.
Historical in/out of the money lowest in 2024
Source: IntoTheBlock
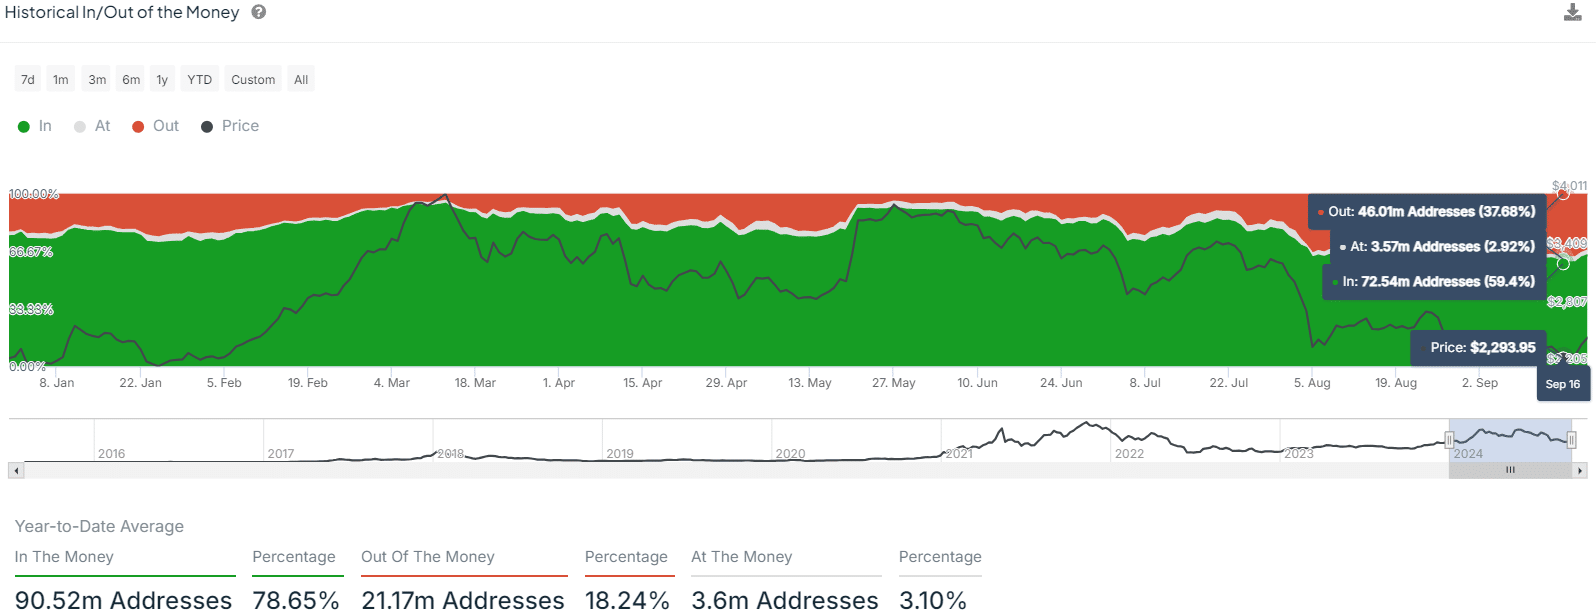
The in/out of the money data for the year 2024 reached its lowest point on the 16th of September. Only 59.4% of all wallets were in the money back then, although this figure rose to 64.4% on the 20th of September.
This marked the lowest percentage of addresses in the money in the year 2024. Less than two weeks ago, ETH was trading at $2.3k.
At the start of the year, ETH prices were at $2,250, meaning that the progress this year has been very slim, especially compared to Bitcoin [BTC].
Source: IntoTheBlock
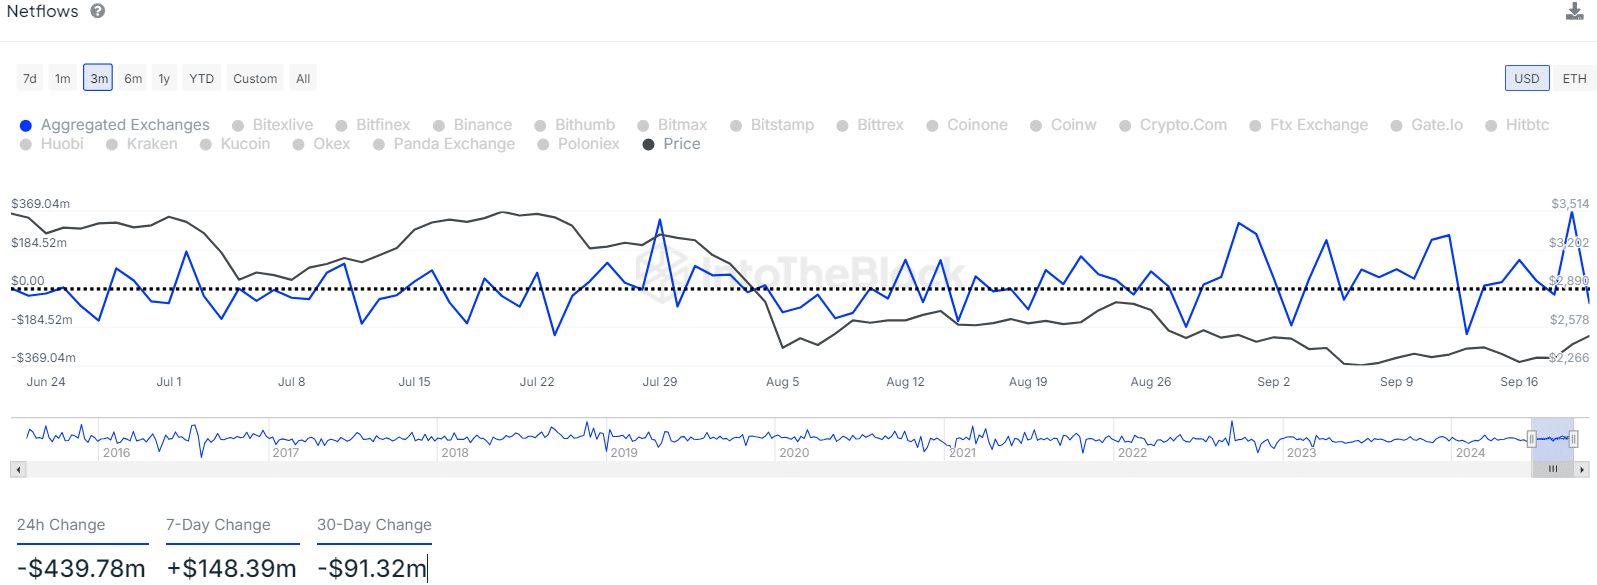
The netflow metric showed that the past 24 hours saw $439 million worth of Ethereum flow out of exchanges. The 7-day and 30-day changes were less extreme and revealed the oscillating nature of netflows.
Overall, accumulation is underway, but it has been slow. Investors will be hoping the demand increases rapidly in Q4 2024.
Gauging momentum and ETH holder sentiment
Source: Santiment
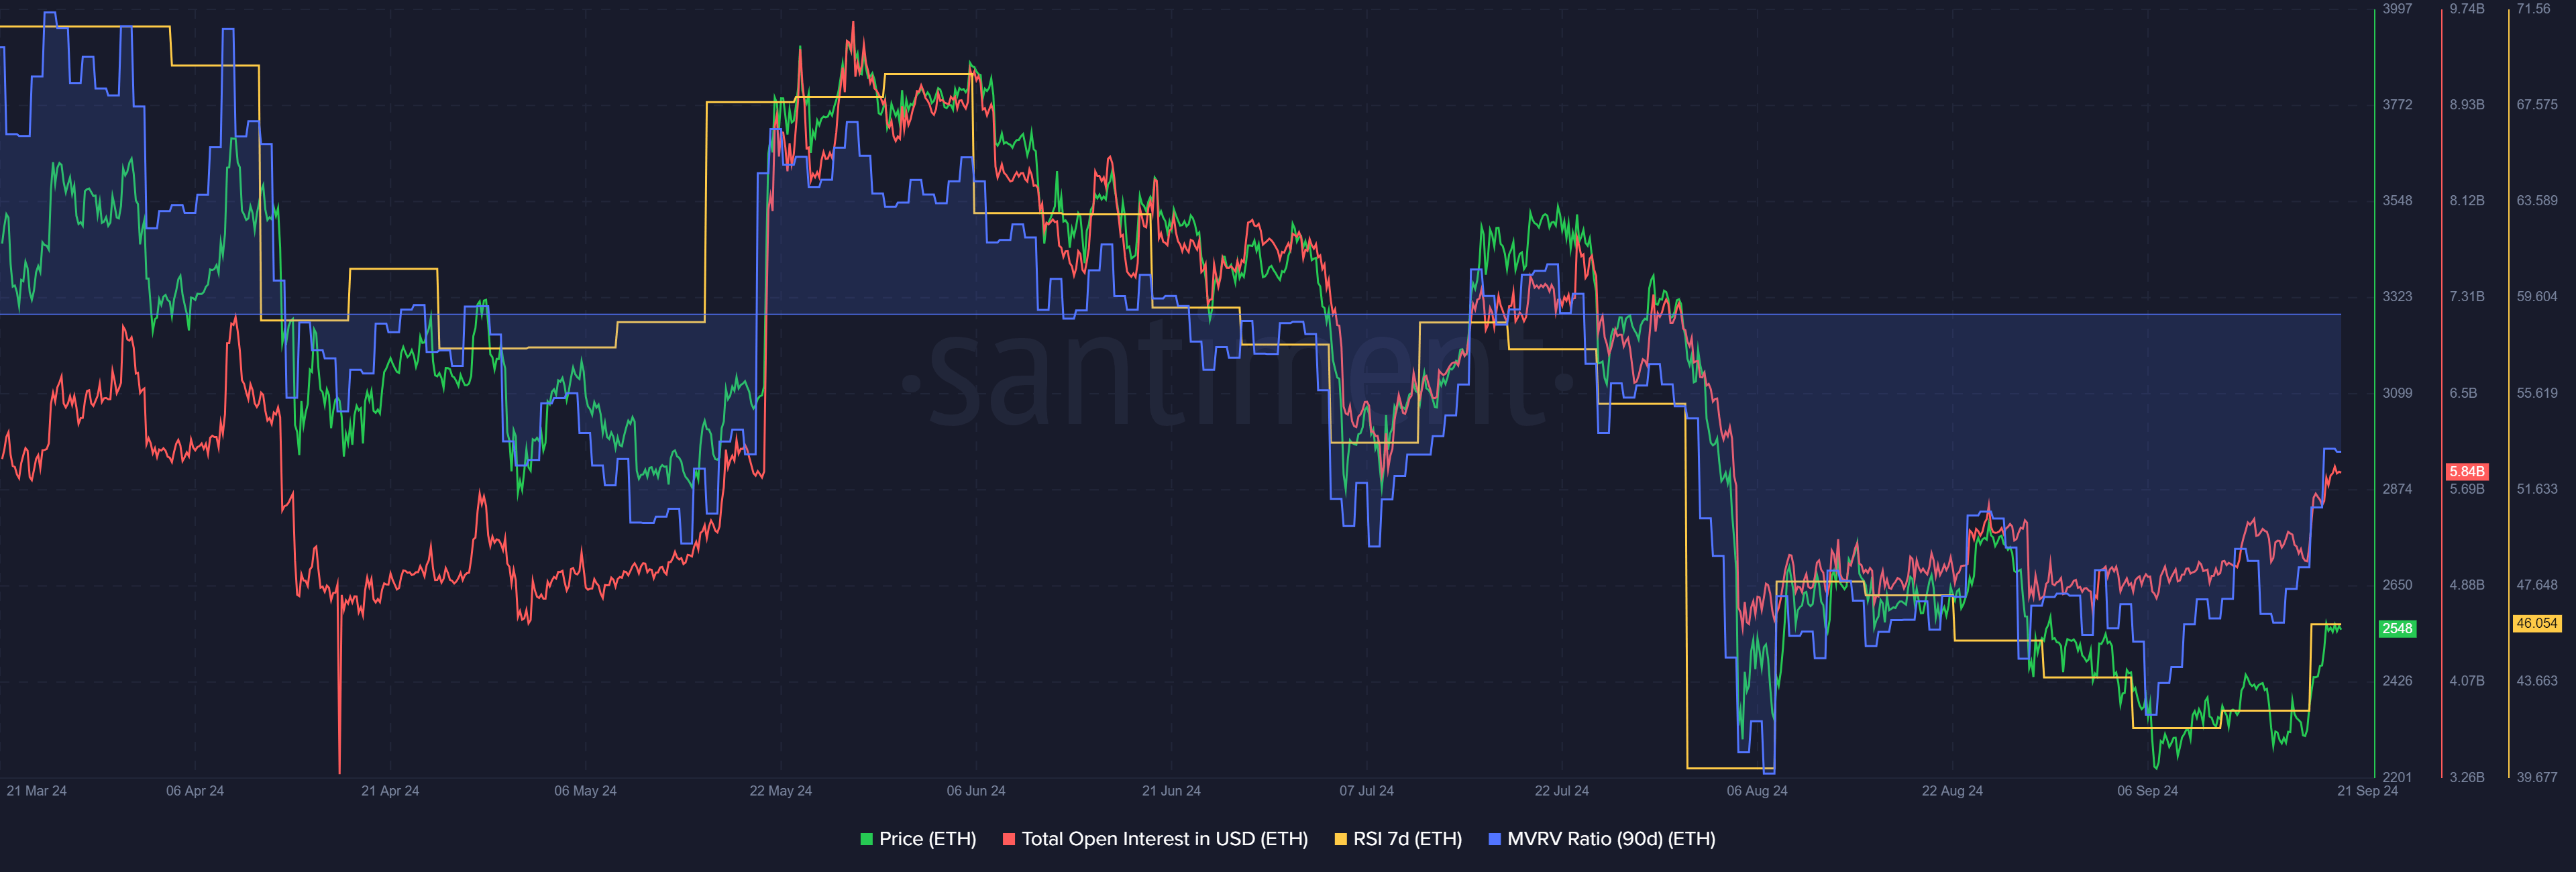
The 90-day MVRV was at -8.45% on the 21st of September, which was quite a high loss that three-month holders were enduring. The sharp downtrend in June caught many investors offside, and the metric reached -27.98% on the 7th of August.
Read Ethereum’s [ETH] Price Prediction 2024-25
This was another indication that rapid price gains would be difficult for Ethereum due to holders who could sell the asset during a rally, looking to get out at break-even.
The Open Interest noted a steady increase over the past month to signal more speculative activity. The 7-day RSI was at 46, showing that the weekly momentum was bearish but was on the verge of shifting bullishly.