![Will Hedera's [HBAR] key $0.0514 support hold or break?](https://ambcrypto.com/wp-content/uploads/2024/08/hbar-webp-1200x686.webp)
- The Hedera network has posted a significant increase in revenues from transaction fees and new addresses.
- However, HBAR has not responded to the network growth, as it continued to underperform.
Hedera [HBAR] has not been one of the top performers across the cryptocurrency market over the past year. In fact, the altcoin has lost 39% of its value year-to-date.
However, despite the bearish price outlook, the Hedera network has seen significant growth. Per a recent report by Messari, the network saw an upsurge in key metrics during the second quarter of 2024.
Hedera’s network growth
According to the report, revenue derived from transaction fees on Hedera in Q2 2024 reached $1.4M. This was the second-highest quarterly level and a 26% quarter-over-quarter jump.
The average number of new addresses during the quarter also jumped by 31% to 11,000, while average daily transactions posted the largest gain of 46% to 132.9 million.
Moreover, despite HBAR’s price showing signs of weakness this year, the report noted that its market cap ranking rose. This was largely because of an increase in circulating supply.
While this outlook paints a bullish image, other on-chain metrics offer a contrasting view. Hedera’s Total Value Locked (TVL) has dropped from a yearly high of $156M to the current $46M as seen on DeFiLlama.
This showed a significant decline in activity by decentralized finance applications.
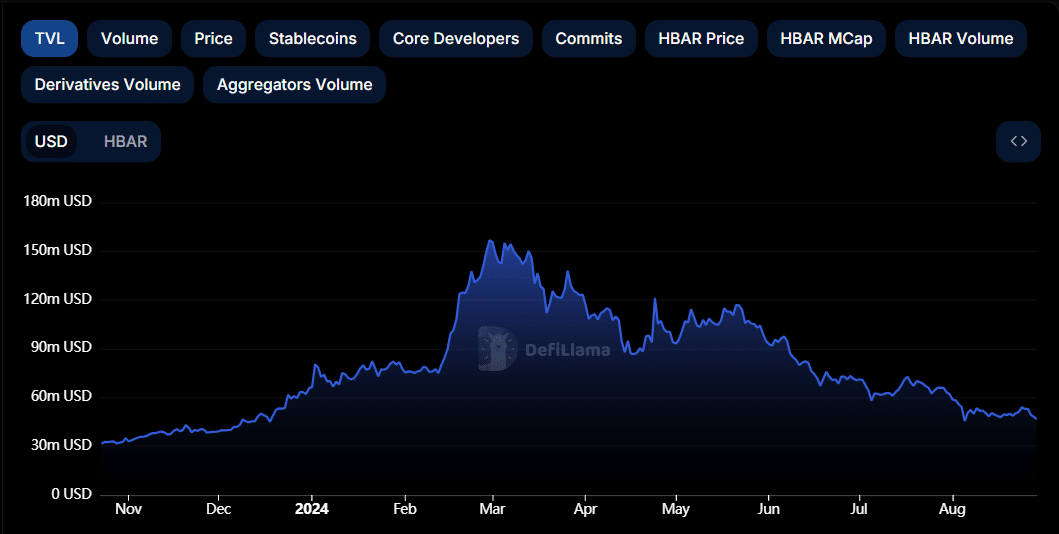
Source: DefiLlama
With on-chain data showing mixed signals, is HBAR ready for a breakout or will the bearish trend continue?
Will HBAR break the bearish trend?
Hedera was trading at $0.051 at the time of writing after a 3.8% drop. A look at the daily chart showed that the token has consolidated within the $0.0514-$0.062 range since early August.
$0.514 was acting as a key support level for HBAR, as it has held firm in recent weeks. If the price fails to hold this level, it will drop to collect liquidity at $0.0453, or even push lower.
Each time HBAR has tested $0.514, the price has bounced. This indicated a high concentration of buy orders at this price.
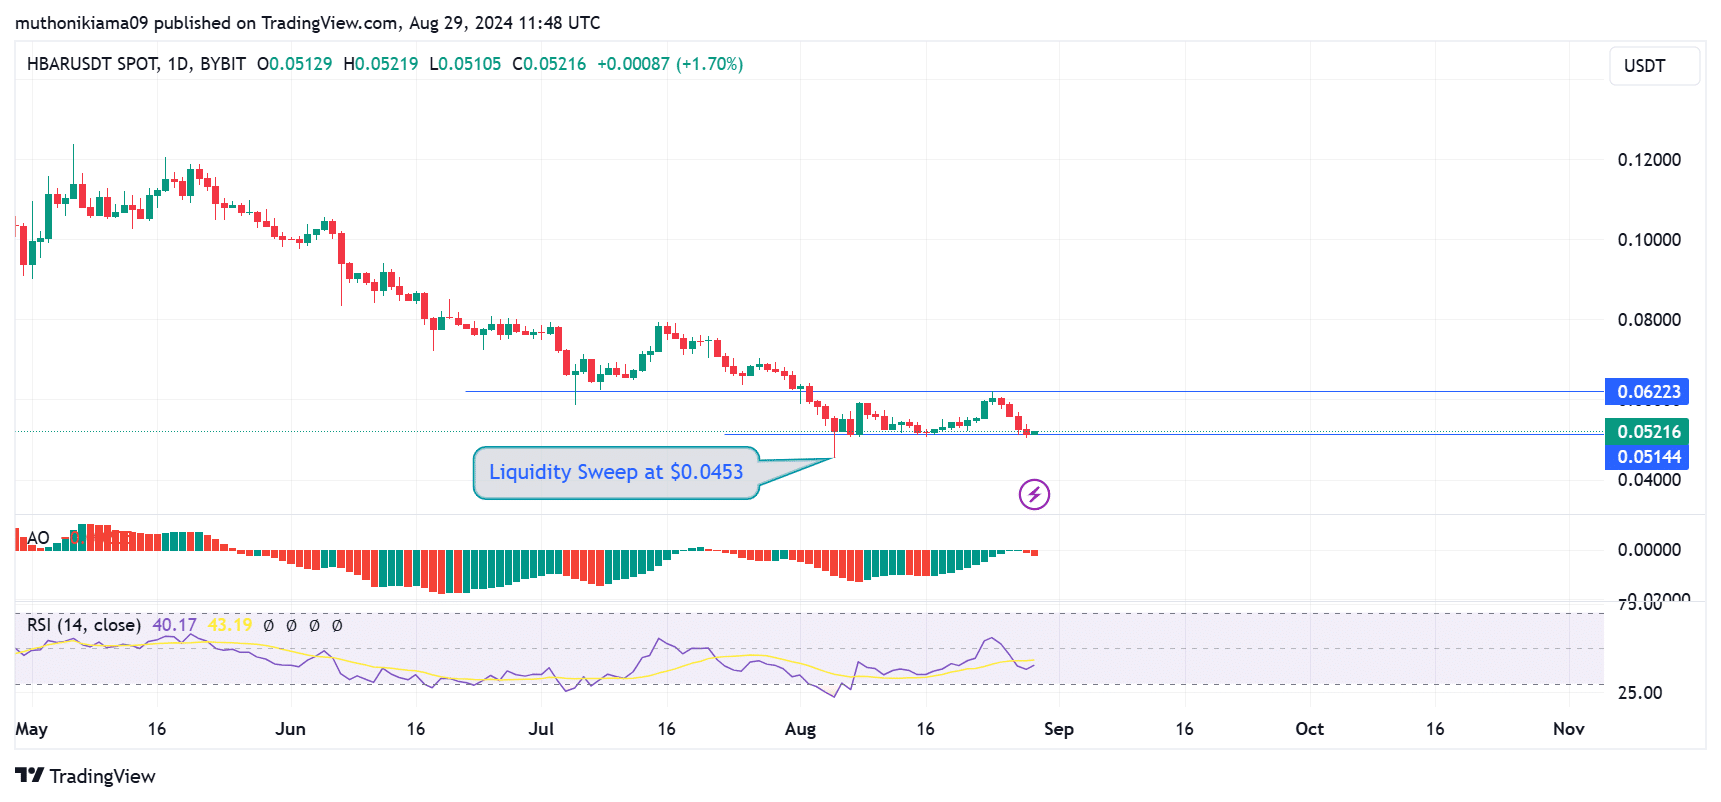
Source: TradingView
The Relative Strength Index (RSI) at 40 showed bearish momentum. However, after the price tested the support again, the RSI bounced, suggesting that this support might continue to hold.
Over the past month, bears have been in control of the price action. The Awesome Oscillator has shown a steady downtrend since early August.
The AO has also failed to flip positive for weeks, further indicating bearish momentum.
Read Hedera’s [HBAR] Price Prediction 2024–2025
Data from Coinglass further showed that HBAR’s Funding Rates have been predominantly negative over the past two months. This indicated a prolonged bearish sentiment as traders took short positions.
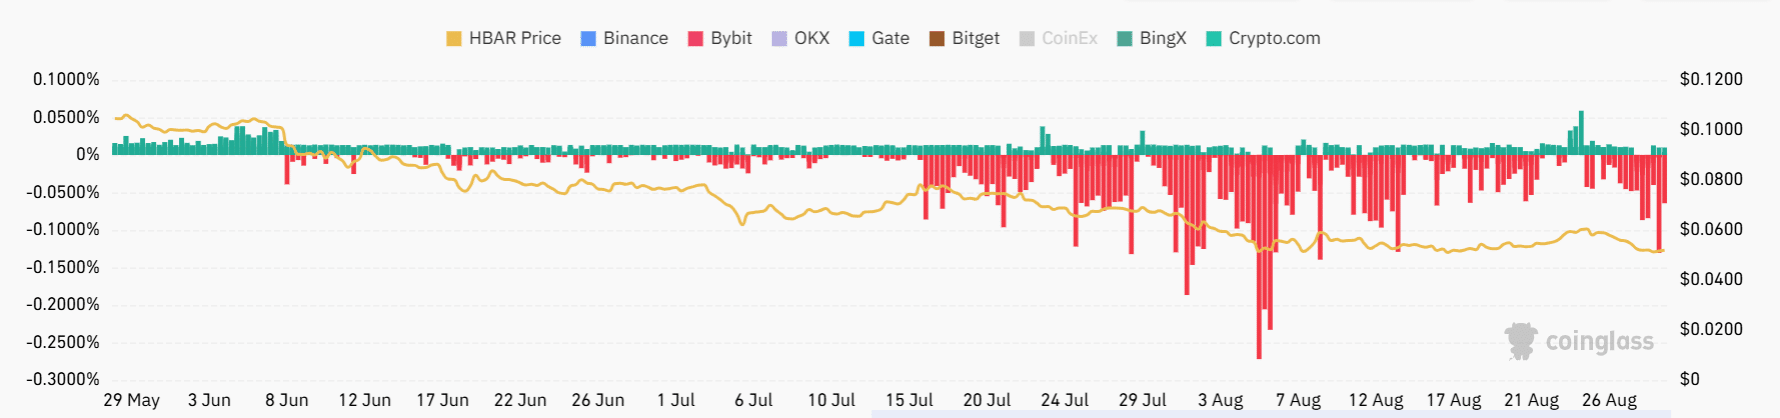
Source: Coinglass
Therefore, for HBAR to break the bearish trend, it needs an upsurge in buyer interest and support from the broader market.