Will MANA fall another 6% as selling pressure ramps? Analyzing…

Disclaimer: The information presented does not constitute financial, investment, trading, or other types of advice and is solely the writer’s opinion.
- MANA’s price remained stuck within a range, but bearish momentum took over.
- A retest of the range lows could interest bulls.
Over the past ten days, Bitcoin [BTC] has stubbornly traded within the $27.7k-$28.7k. Neither the bulls nor the bears had the strength yet to push beyond this near-term range. Decentraland [MANA] was one such altcoin that traded within a tight range alongside BTC.
Read Decentraland’s [MANA] Price Prediction 2023-24
The speculators appeared to be slightly bullishly biased, but the four-hour price chart of MANA showed that the token was likely to experience losses of close to 6% over the next week. Thereafter, a buying opportunity could present itself.
The mid-range resistance proved too strong for the bulls once again
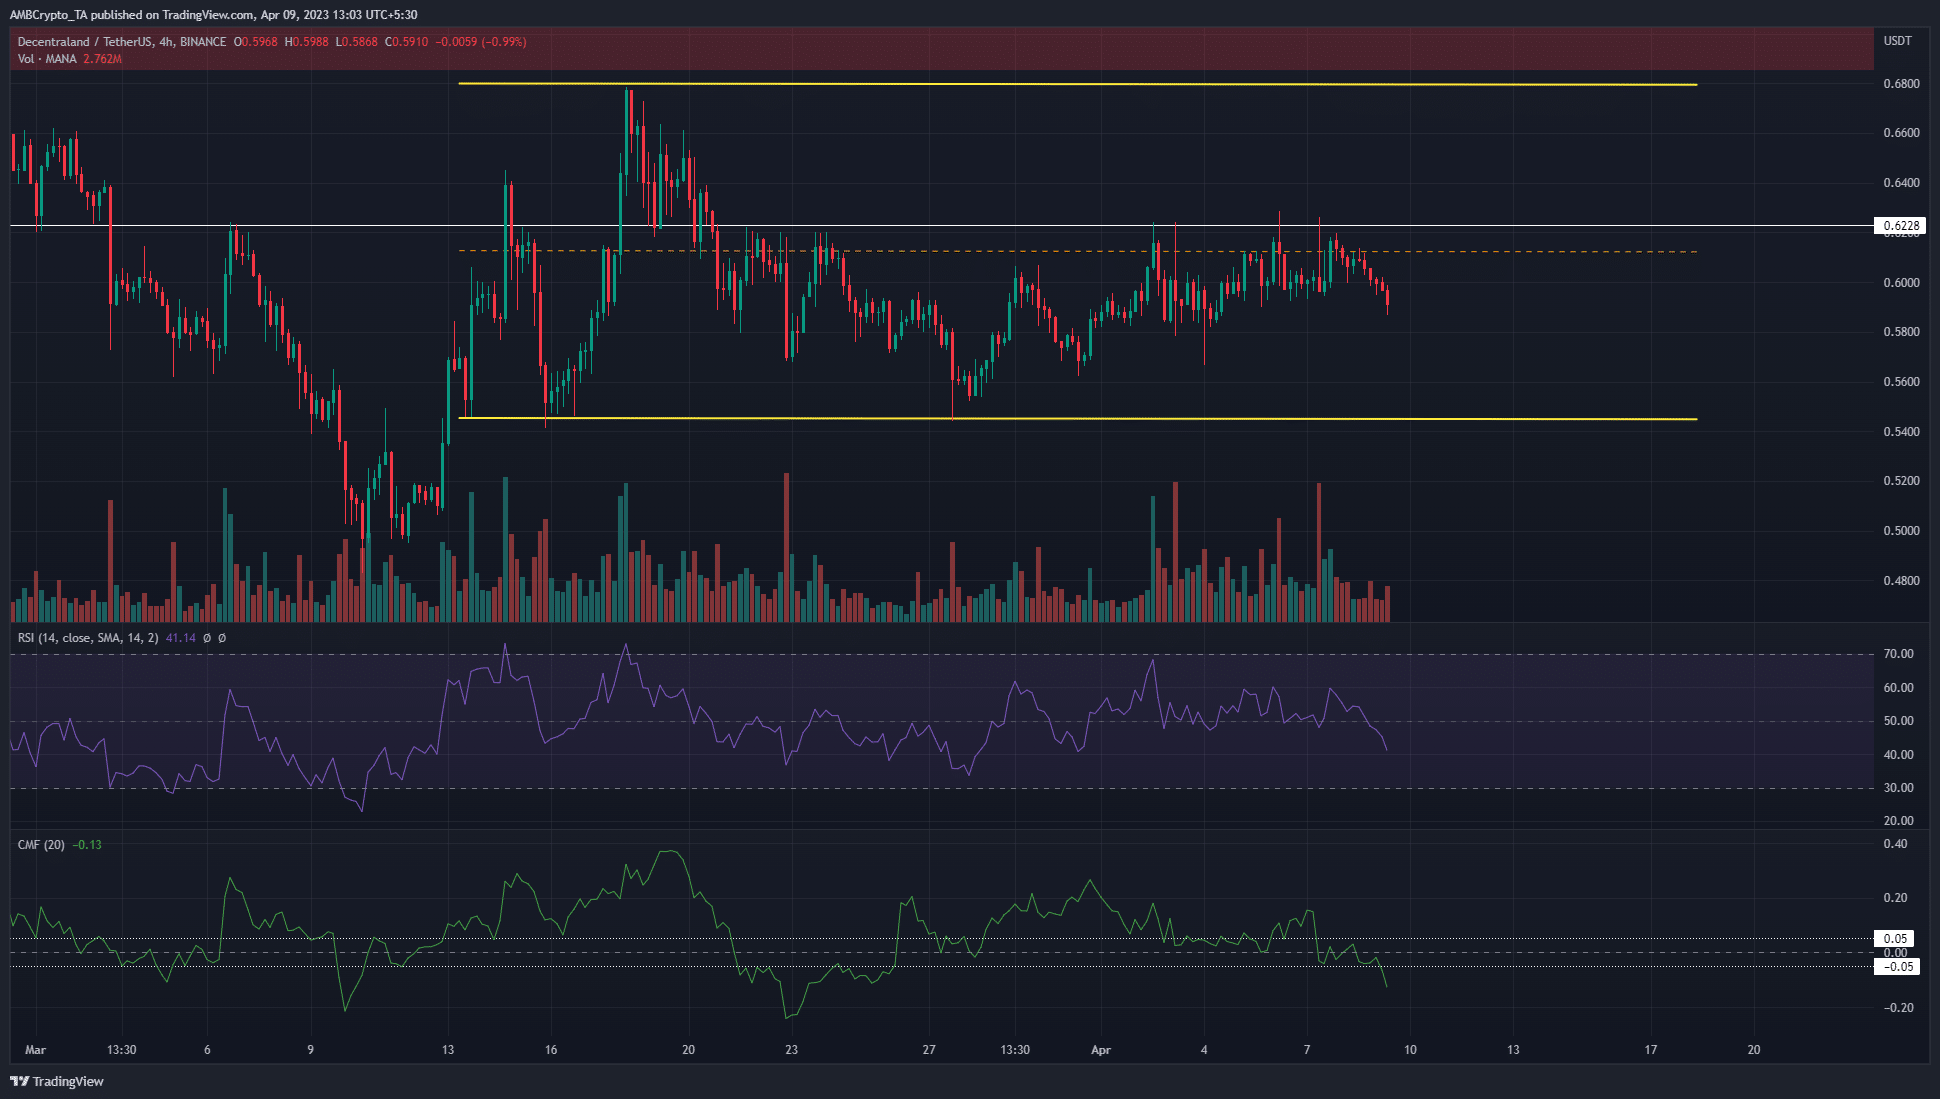
MANA traded within a range (yellow) that extended from $0.545 to $0.68 since 18 March. In the three weeks since the mid-range level at $0.612 has served as both support and resistance. In the past week, it has been a stern level of resistance.
Even though MANA bulls have formed a series of higher lows on the four-hour price chart since late February, the bearish stronghold at the $0.61 region was not pierced. Moreover, the indicators showed that selling pressure had increased.
The RSI dived beneath the neutral 50 line and its reading of 41 at press time showed bearish momentum was strengthening. The CMF also fell below -0.05 to show significant capital flow out of the market.
The bullish enthusiasm in early April was cut back several notches
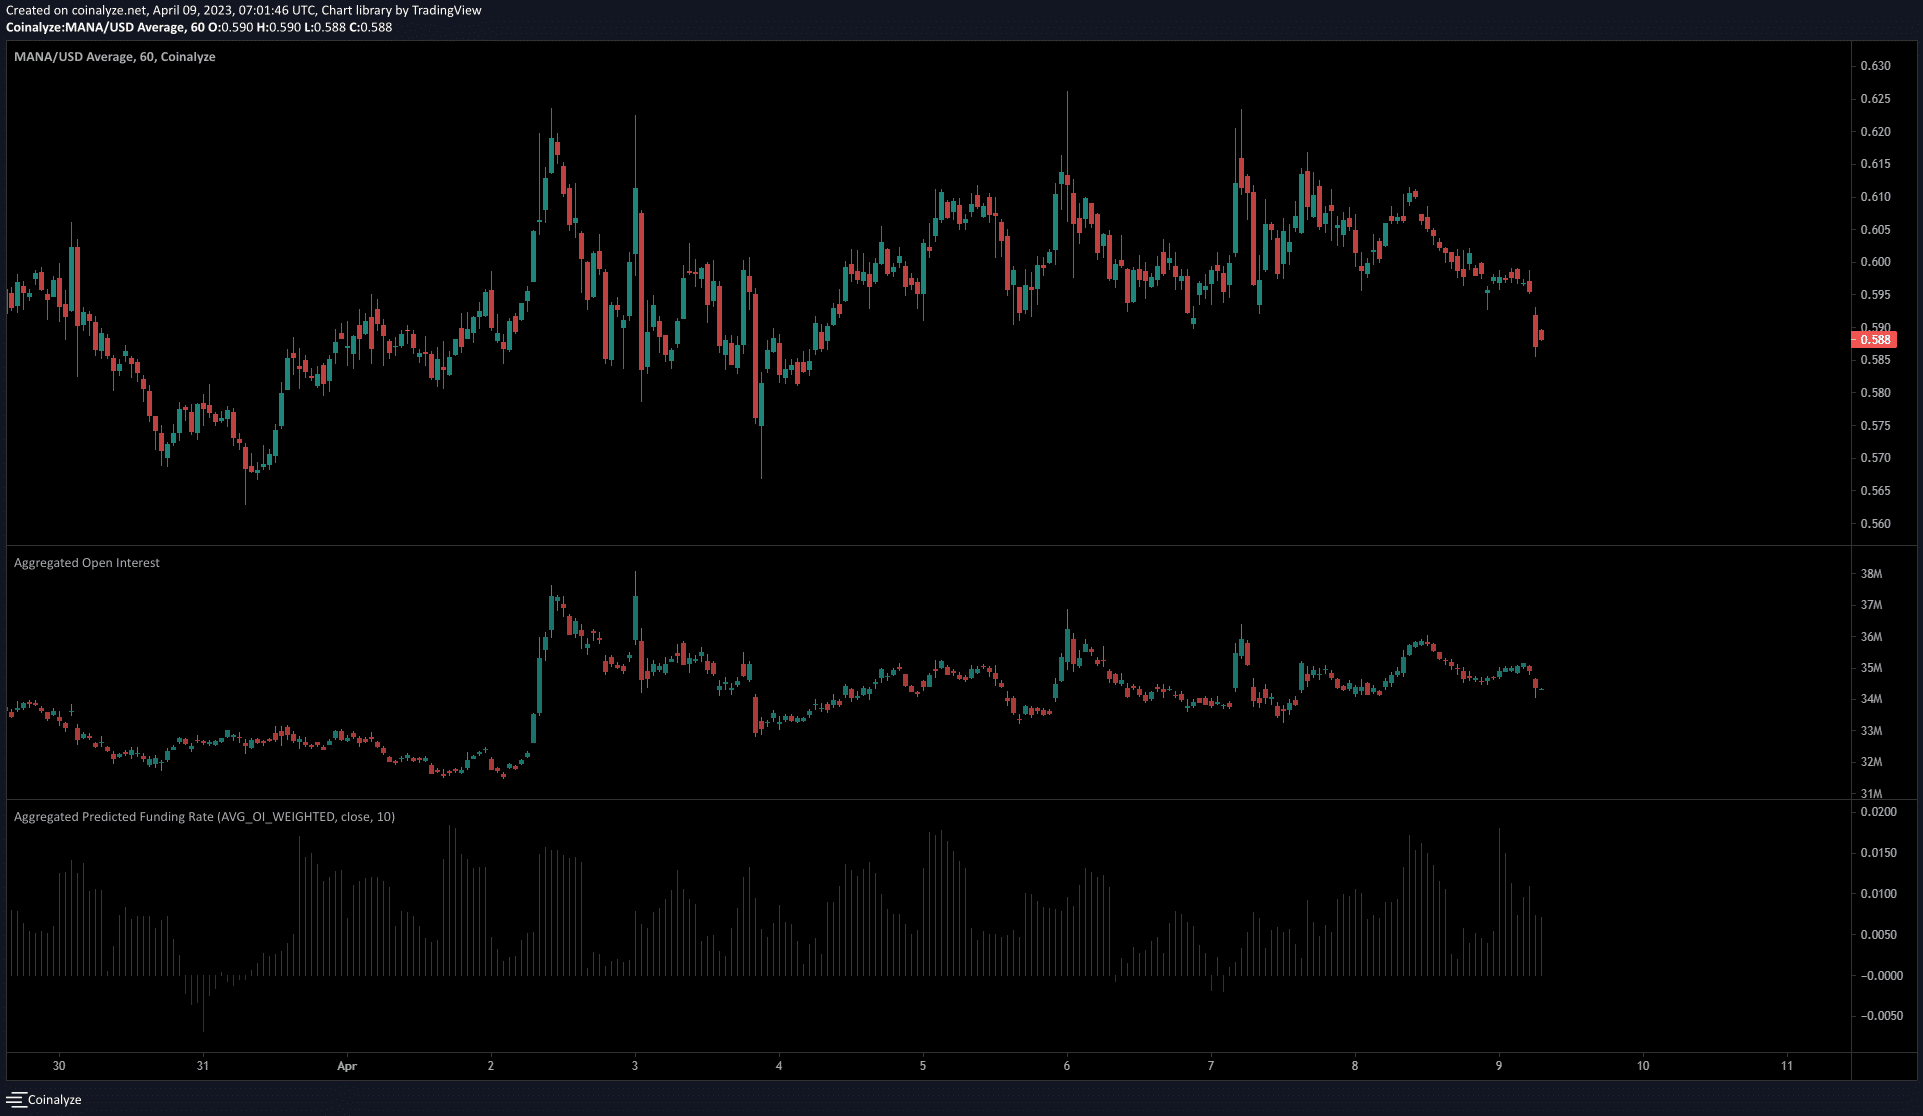
On 2 April, the price of MANA shot upward to touch $0.62. This was accompanied by a significant rise in Open Interest, while the funding rate was positive as well. Since then, the OI has slowly bled lower while the price continued to hover around the $0.59-$0.61 area.
Realistic or not, here’s MANA’s market cap in BTC’s terms
The positive funding rate showed bulls were in the majority, but many of them could be forced to close their positions early if Decentraland witnessed another wave of selling.
The lack of sustained OI increase meant speculators weren’t ready to bet on a bullish MANA yet, which could presage more sideways or downward trading for the token.