
- Bearish sentiment around the token increased.
- $0.93 was MATIC’s next crucial support level.
Polygon [MATIC] crossed a critical resistance zone in the last few days that hinted at yet another bull rally. However, things were quick to change as MATIC’s value dropped sharply on the 1st of April. Will MATIC bears control the beginning of Q2?
Polygon investors are in shock
World of Charts, a popular crypto analyst, recently posted a tweet highlighting the fact that MATIC managed to break above a resistance level. This was the case as its price increased toward $1.
If MATIC tested that level, then the token’s price could have reached $1.01. However, that did not translate into reality as the token witnessed a price correction.
According to CoinMarketCap, MATIC was down by over 3% in the last 24 hours alone. At the time of writing, it was trading at $0.9659 with a market capitalization of over $9.5 billion, making it the 17th largest crypto.
The price drop also had an impact on its social metrics. Polygon’s social volume increased, reflecting that the crypto space was talking about the token.
Bearish sentiment around it also increased substantially, which was evident from the massive dip in its weighted sentiment.
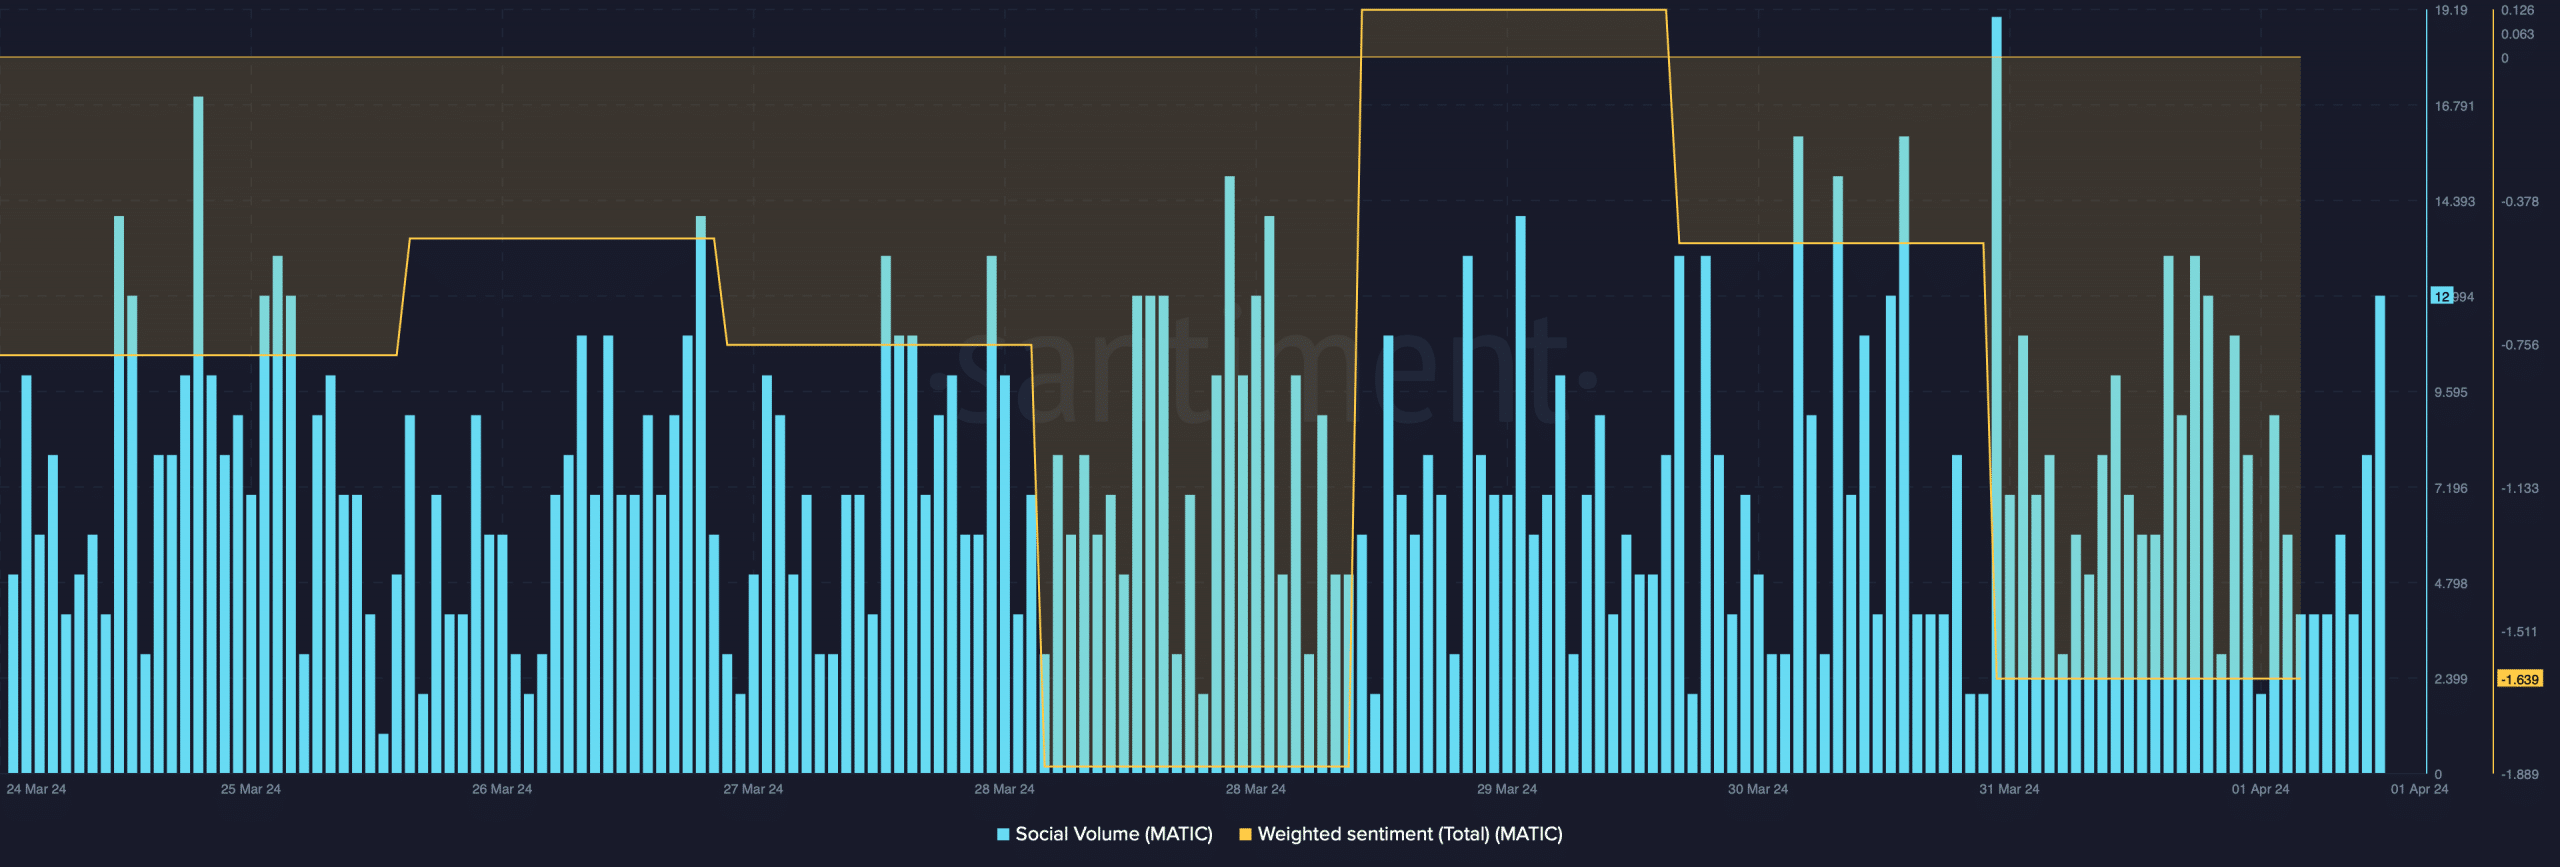
Source: Santiment
AMBCrypto then checked Hyblock Capital’s data to understand what caused this downtrend. Our analysis revealed that MATIC’s liquidation skyrocketed when its price touched $1.
High liquidation means high selling pressure, which generally causes price drops. The worst part was that MATIC wasn’t able to test its support level near $0.97 and fell under. This indicated that the token’s price might go down further.

Source: Hyblock Csapital
Will Polygon’s downtrend last?
To understand whether the downtrend would last, AMBCrypto took a look at CryptoQuant’s data. We found that MATIC’s exchange reserve was increasing, meaning that selling pressure on the token was high.
Other bearish metrics were its daily active addresses and transaction volume, which also declined in the recent past.

Source: CryptoQuant
The technical indicator MACD displayed a clear bearish advantage in the market. Its Relative Strength Index (RSI) registered a sharp downtick.
Read Polygon’s [MATIC] Price Prediction 2024-25
On top of that, Polygon’s Chaikin Money Flow (CMF) also followed a similar declining trend, hinting that the chances of a continued price decline were high.
If the downtrend continues, investors must watch out for the $0.93 resistance zone, as a plummet under that could be concerning.
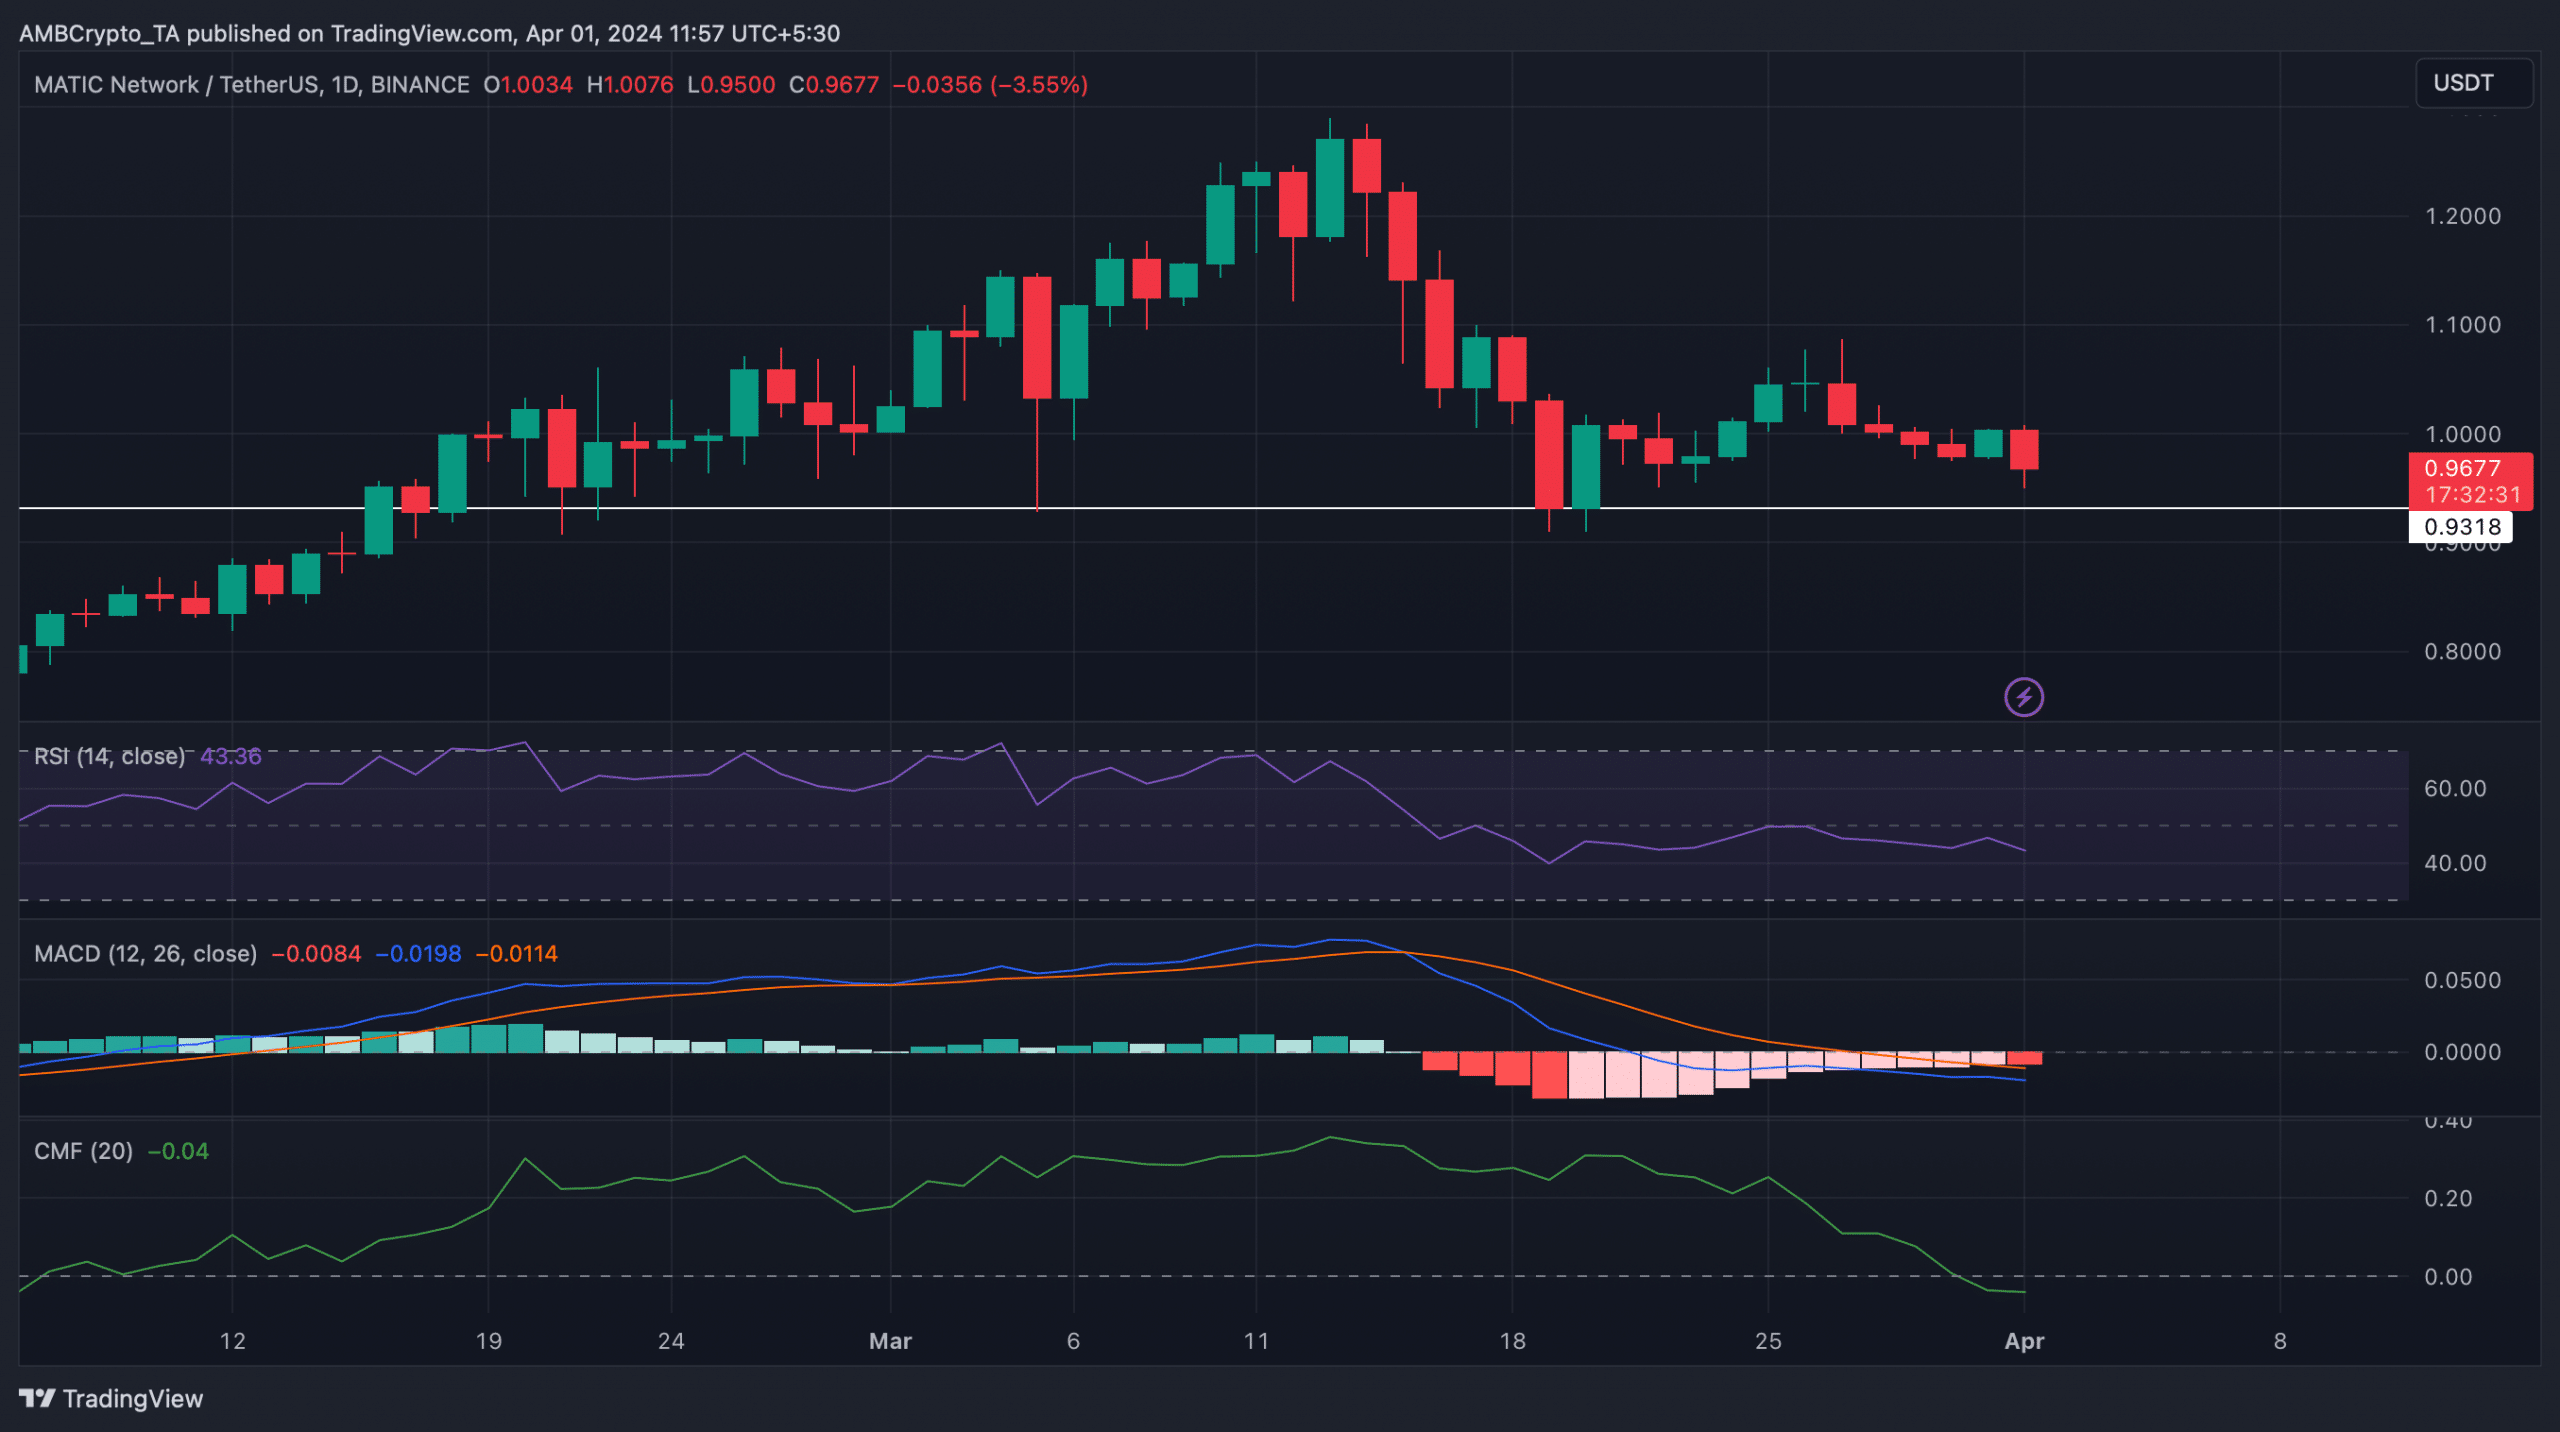
Source: TradingView