Will MATIC’s bullish stance give way to an uptrend in the coming weeks?

Disclaimer: The information presented does not constitute financial, investment, trading, or other types of advice and is solely the writer’s opinion.
- MATIC has a bullish market structure on the daily chart.
- Santiment data and the lower timeframe price action suggested that a bounce from the $0.52-$0.55 region could commence next week.
Polygon [MATIC] has bobbled just above the weekly supply zone at $0.5 for most of the past month. It saw a rally to $0.6 but was forced to retreat to the $0.55 support level. In other news, POL contracts will go live on the Goerli testnet in a major step toward Polygon 2.0.
How much are 1, 10, or 100 MATIC worth today?
A recent report from AMBCrypto analyzing MATIC’s price action highlighted that there was stiff resistance at the $0.59-$0.6 region. Indeed, MATIC saw a reversal from this zone, but can the bulls continue to march higher?
The defense of the $0.5 level was an encouraging sign
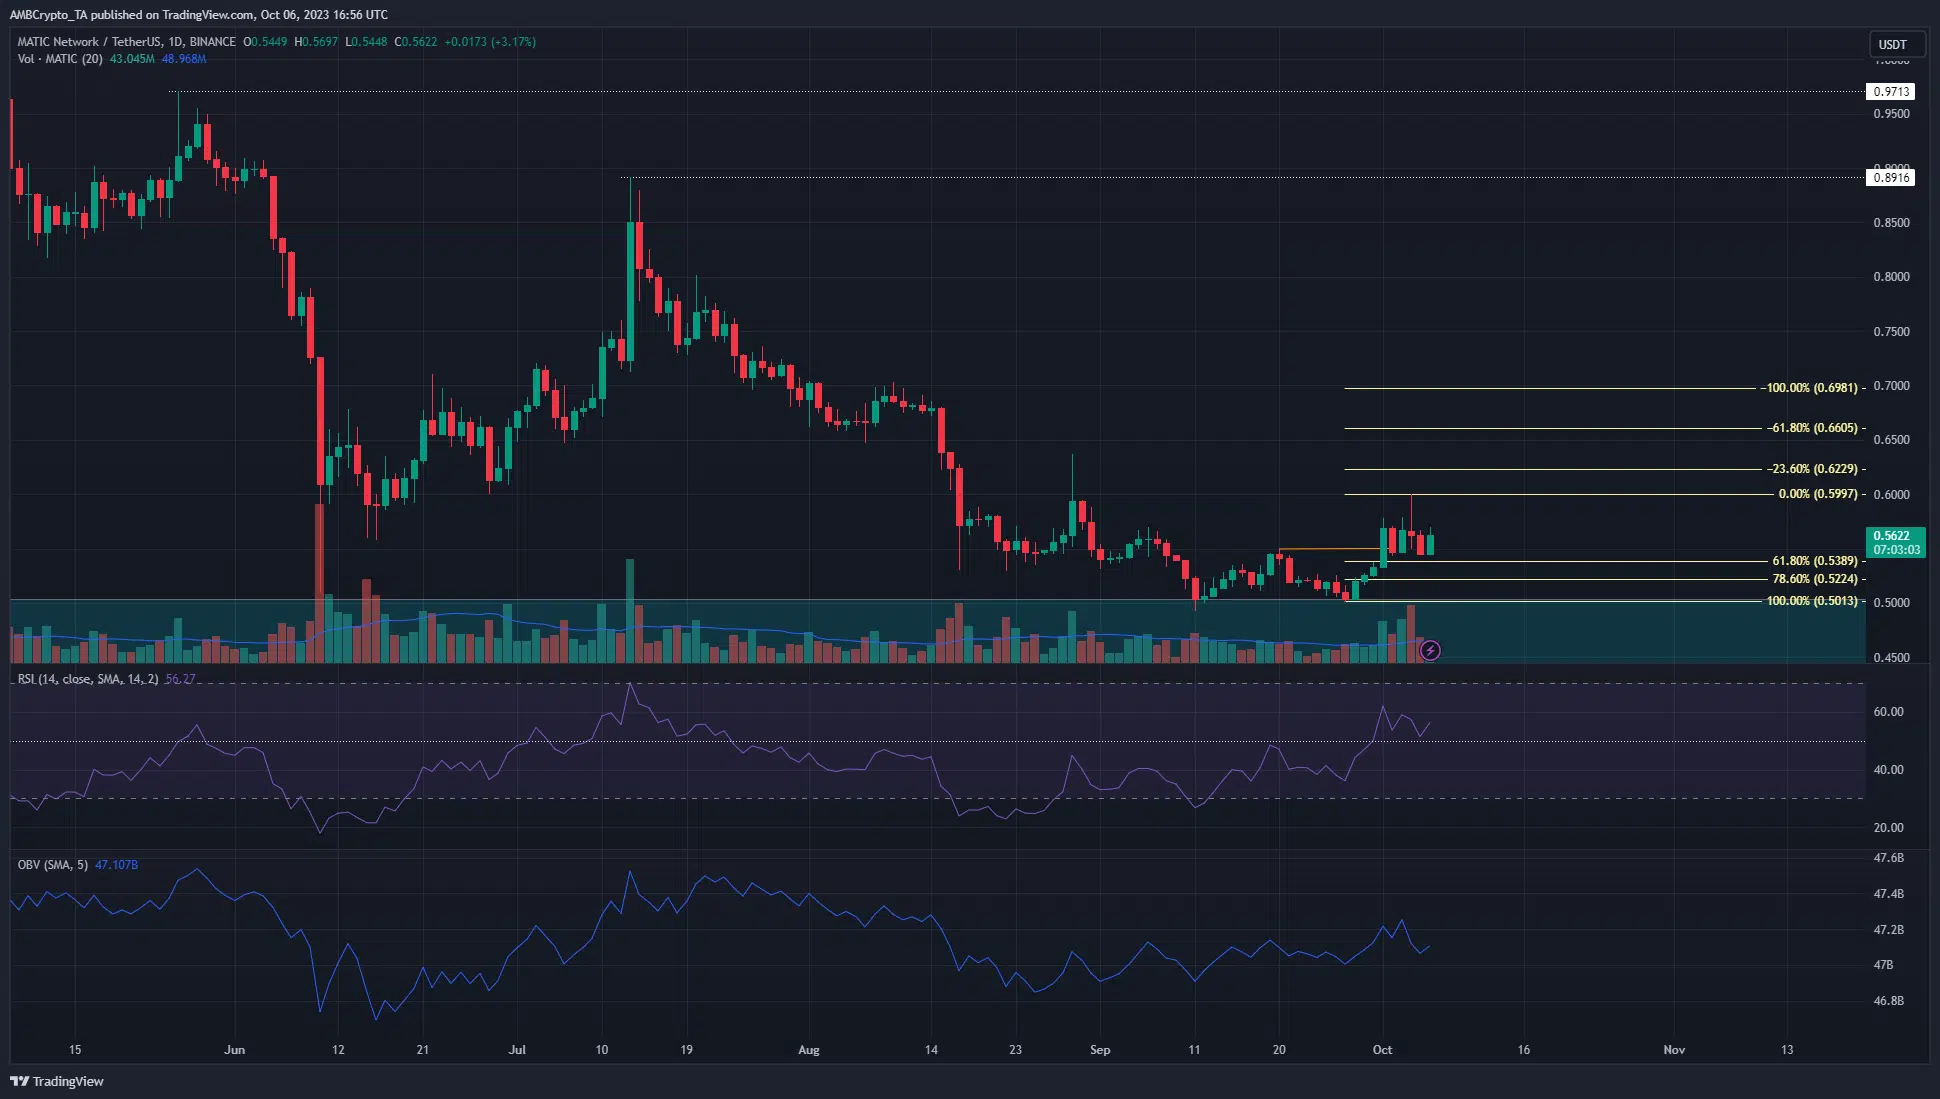
The $0.316-$0.5 zone was a bullish order block from the weekly timeframe. Since June we can see that MATIC bulls have been tenacious in their defense of this region. Over the past ten days, the market structure on the one-day chart saw a bullish flip. This happened on 1 October when the price sailed above the lower high at $0.55 (orange).
This rally almost reached $0.6 and was used to plot a set of Fibonacci retracement levels (pale yellow). The 61.8% level was at $0.5389, and the 78.6% one at $0.5224. Hence this zone could present an attractive buying opportunity targeting the extension levels above $0.6.
While the Relative Strength Index (RSI) concurred with the market structure to reflect upward momentum, the On-Balance Volume (OBV) was slightly muted. It has trended higher in September but we have not yet seen huge spikes higher, like we did in July. This hinted that a move past $0.6 could attract a large volume of buyers to propel prices quickly further.
On-chain metrics showed positive sentiment

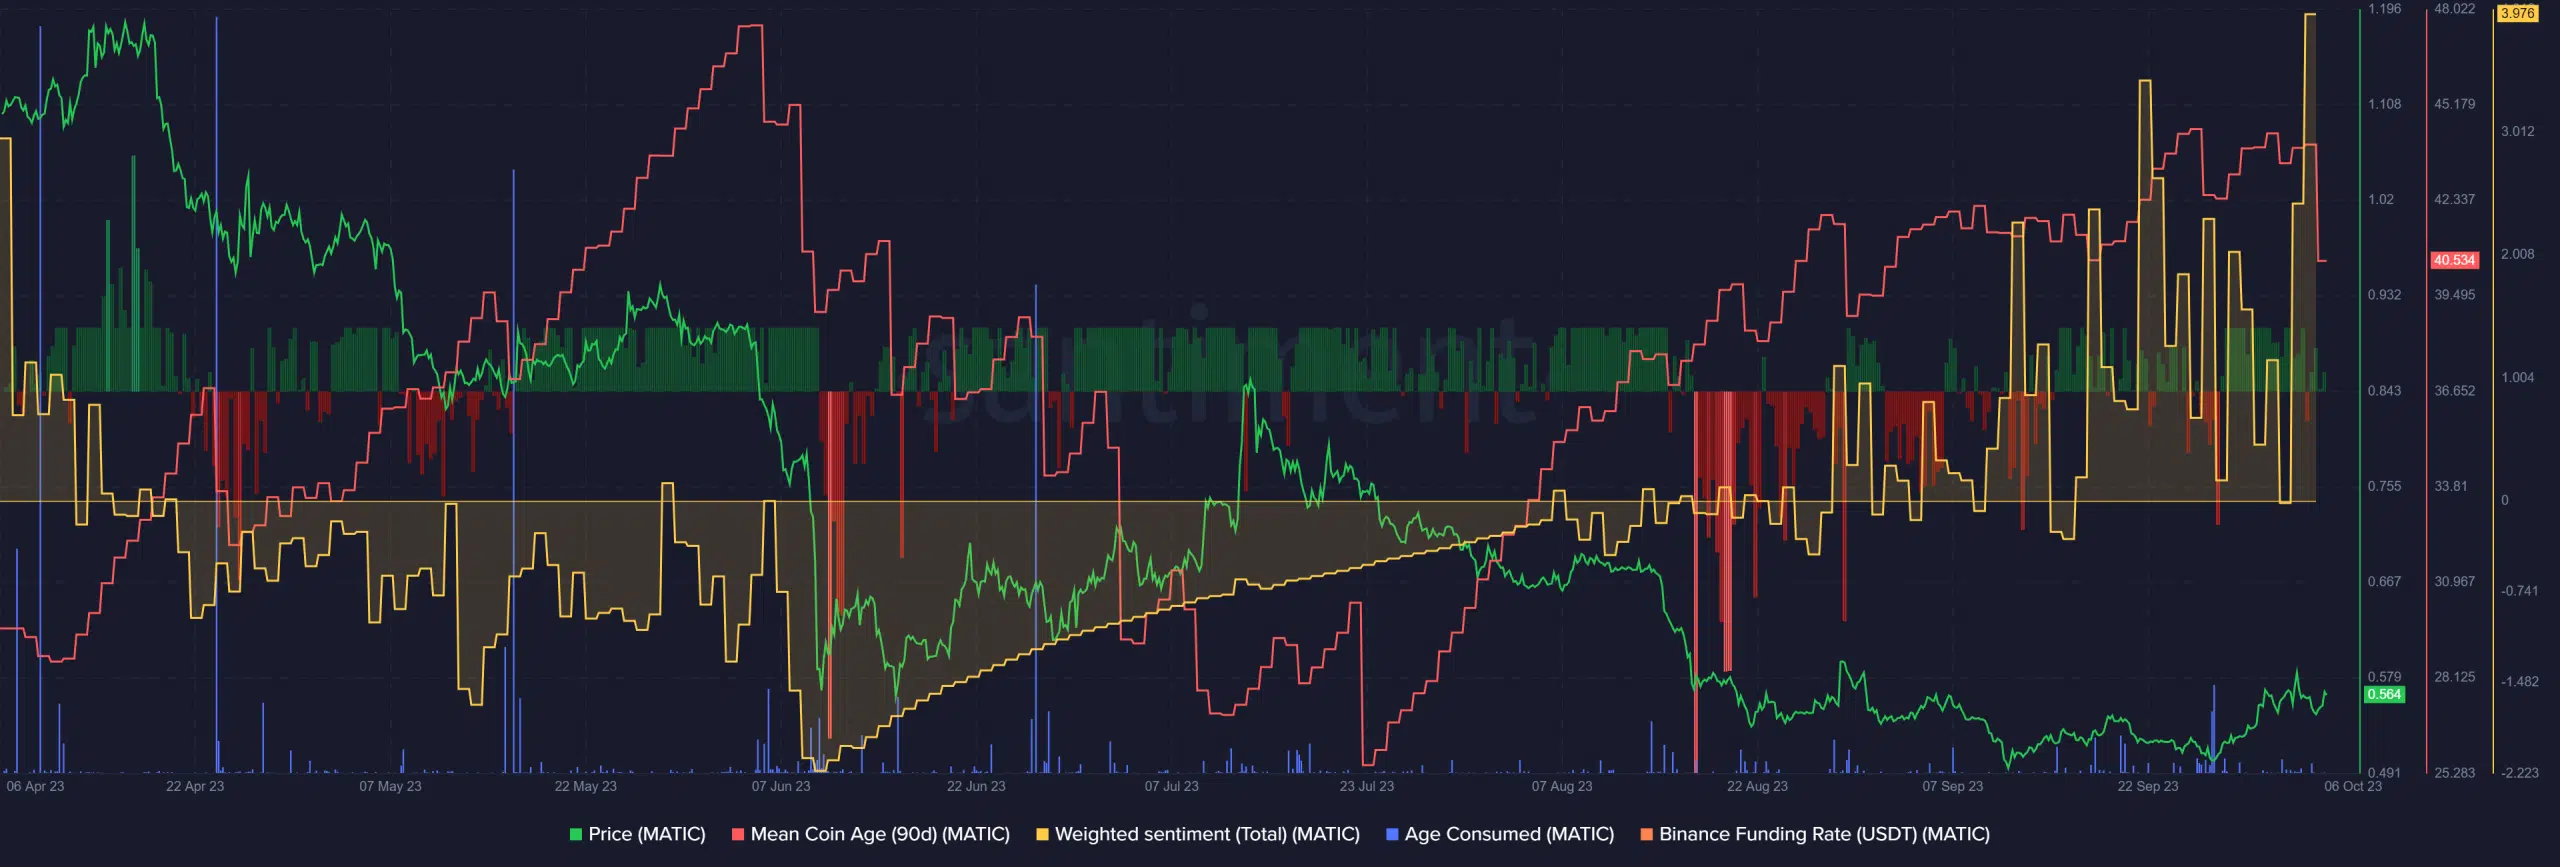
Source: Santiment
The Mean Coin Age metric saw a dip in the hours before press time but has trended upward since late July. It underlined accumulation from holders but a wave of selling on 6 October. The age consumed metric was dormant in the past two weeks. Its latest notable surge came on 27 September when MATIC retested the $0.5 support.
Realistic or not, here’s MATIC’s market cap in BTC’s terms
The funding rate had been negative in mid-August but this began to change after the first week of September. The weighted sentiment was also climbing higher and higher. Together, they showed that MATIC had bullish prospects.


