Will Optimism head lower as bearish bias persists?
Optimism sellers had market leverage and could push OP prices lower. Here are possible levels to consider.

Disclaimer: The information presented does not constitute financial, investment, trading, or other types of advice and is solely the writer’s opinion.
- OP lost hold of $1.4 as sellers overwhelmed the market.
- Network Growth declined as the altcoin traction eased.
Optimism [OP] sellers seemed ready to extend the August gains into September. After blocking OP from going above $1.59 in the second half of August, sellers pushed it even lower in early September. As of press time, the Layer-2 asset was down over 15% from recent highs near $1.59.
Is your portfolio green? Check out the OP Profit Calculator
The altcoin traded at $1.33 at the time of writing and could head lower if Bitcoin [BTC] cedes below its range-low near $25.7k.
Will bulls reverse recent losses?
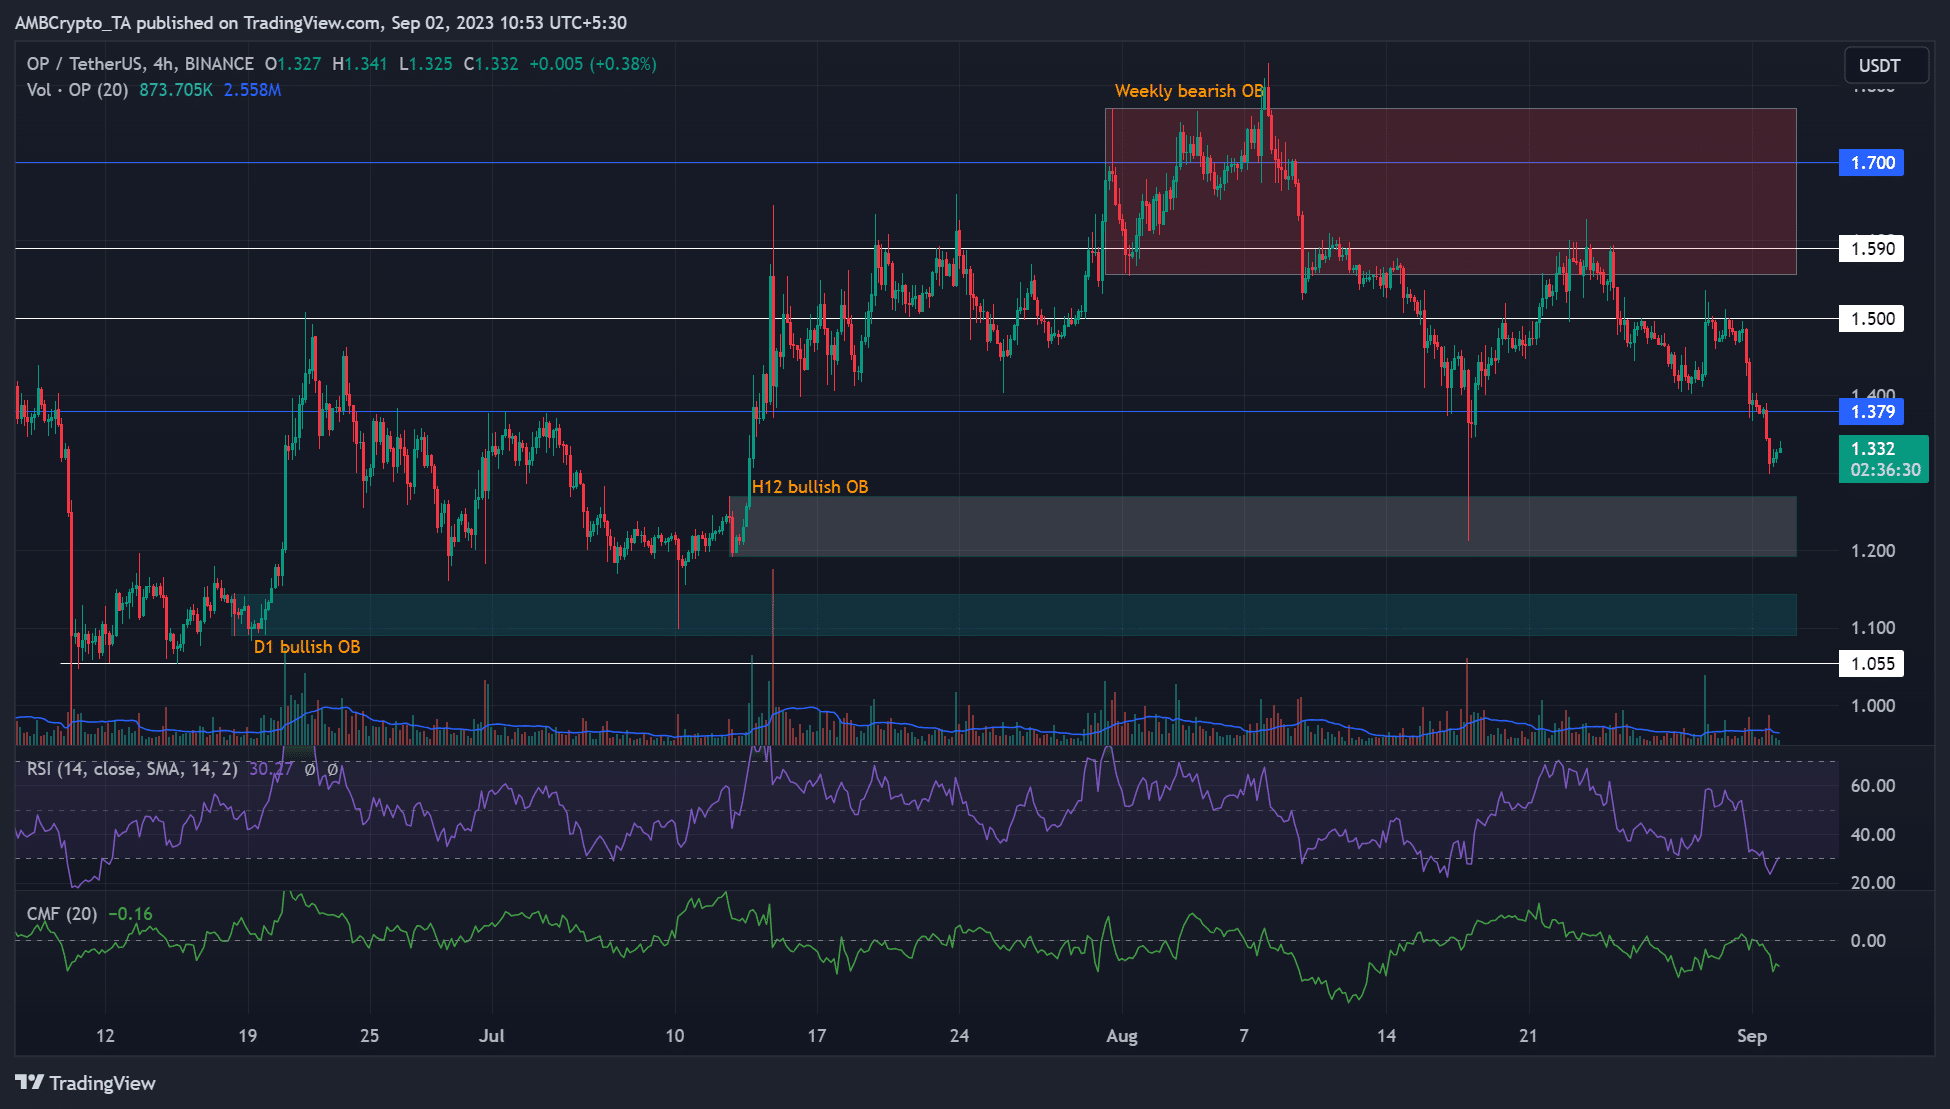
Based on the technical chart indicators, bulls were far from having market leverage in the short term. Notably, at publication, the Relative Strength Index (RSI) attempted to retreat from the oversold zone on the H4 chart.
It shows mild buying pressure on the lower timeframe, but a weak BTC and the immediate overhead hurdle at $1.379 could derail a solid recovery.
So BTC doesn’t recover recently lost ground, sellers could drive OP lower to the 12-hour (H12) bullish order block of $1.19 – $1.27 (white) or the daily bullish OB of $1.09 – $1.14 (cyan). Any further drop below these support zones could see bulls attempt to defend the $1.0 psychological level.
Conversely, OP could aim at $1.5 if bulls reclaim the $1.38 resistance as support, especially if BTC surges to $27k.
Network traction tanked
How much are 1,10,100 OPs worth today?
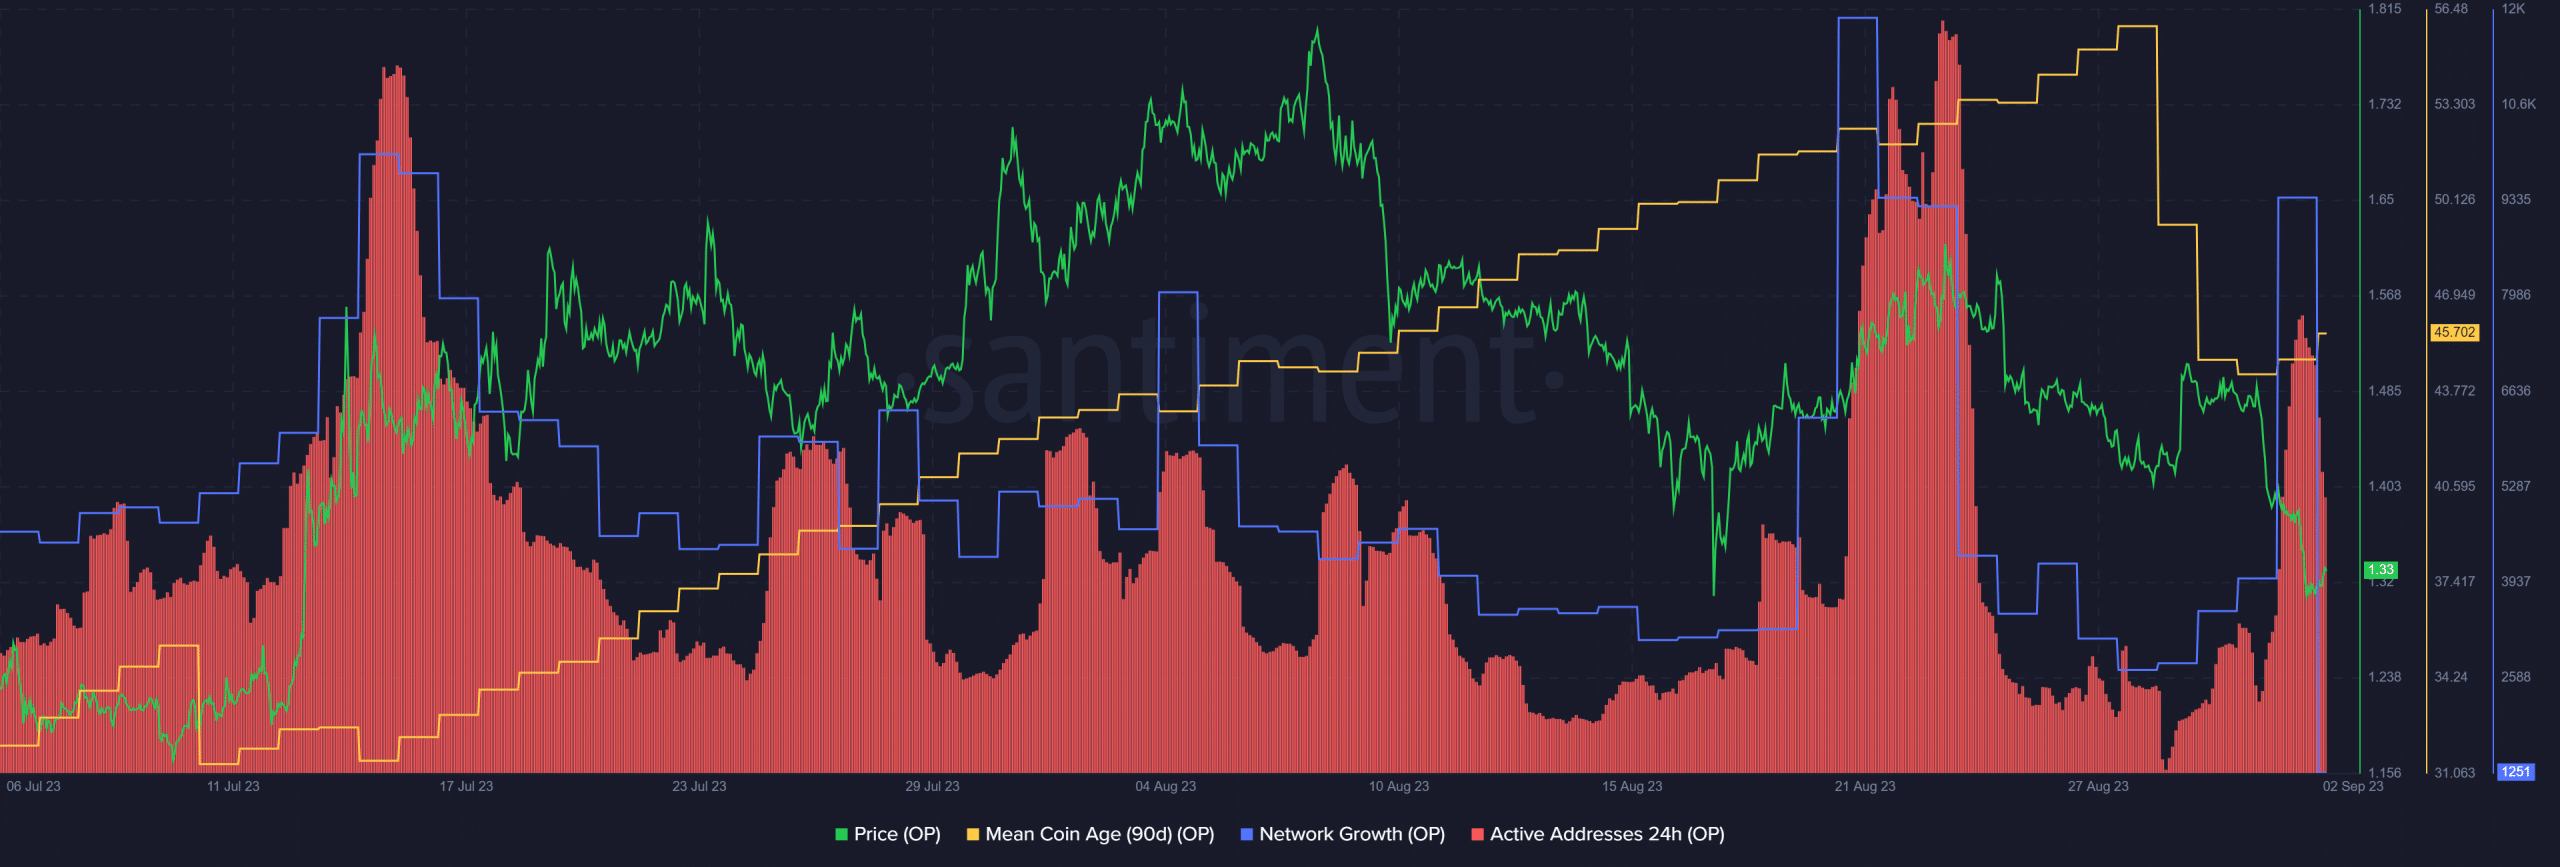
According to Santiment, a crypto intelligence data platform, the bearish grip was prevalent. Notably, the Network Growth (blue) declined significantly, indicating the number of new addresses dropped and overall network traction slowed.
Furthermore, the recent price drop was marked by elevated sell volume (red) alongside 90-day Mean Coin Age drop-offs. Collectively, these on-chain metric readings cement the short-term bearish pressure.


