Will Polkadot fall below its $2 ATL? Assessing key levels
After starting the year on a high note, trading as high as $11.889, DOT has once again entered a period of difficulty.

- There is a risk that DOT could plummet to or below its historical low of $2.00 if it fails to hold the support level at $4.001.
- A noticeable lack of interest from retail investors indicates a potential decline for DOT.
Over the past year, Polkadot’s [DOT] market performance has been notably weak, underperforming substantially with a 3.36% decrease that erased most of the gains for spot holders.
This downtrend was consistent across both daily and weekly timeframes.
Further analysis conducted by AMBCrypto suggested that DOT holders may need to brace for losses if the crucial support level does not hold.
Will major support help DOT?
At press time, DOT actively traded at $4.125, descending toward the support level of $4.001.
This support level has previously sparked two significant rallies for DOT. However, the buying pressure that catalyzed these surges appears to be diminishing.
Initially, when the price reached this support level, it rallied by an impressive 1144.19%. During its second approach, the increase was more modest at 197.15%.
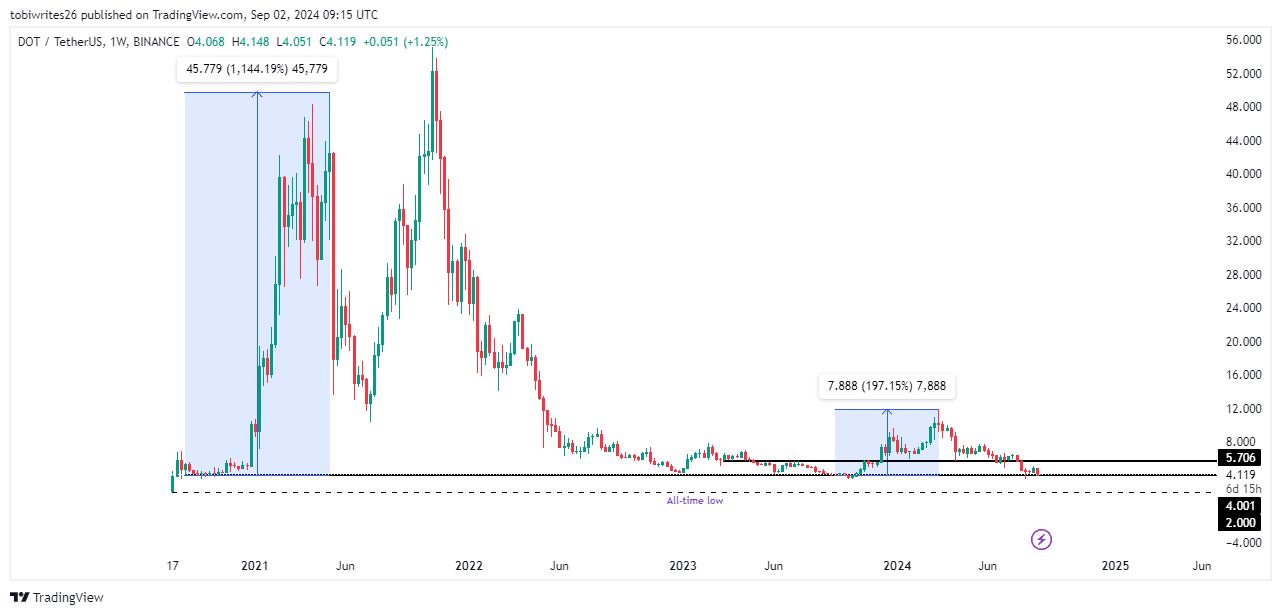
Should market patterns hold and DOT reaches this support level again, it could potentially rebound to the $5.706 resistance, where it may face selling pressure.
Further analysis by AMBCrypto suggests that the support at $4.001 is likely to fail, as selling pressure from retail traders intensifies.
Retail traders withdrawing support for a DOT rally
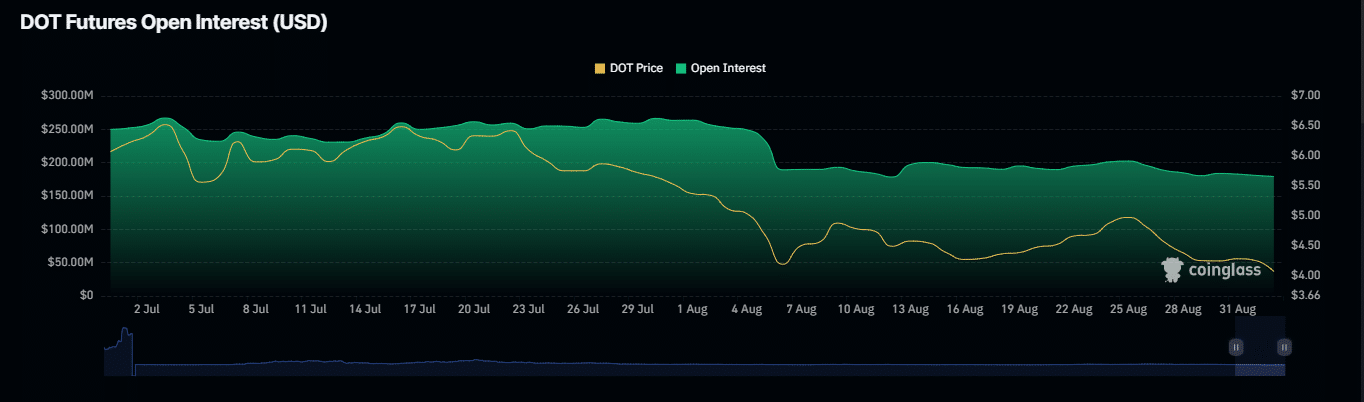
Open Interest (OI), a key indicator of liquidity and market activity, suggested weakening enthusiasm for DOT.
According to Coinglass, DOT’s OI has declined immensely, from $202.30 million to $178.9 million since the 25th of August. This drop indicated that retail interest in sustaining DOT’s price was faltering.
Further insights from Coinglass, as analyzed by AMBCrypto, revealed that long traders have faced substantial liquidations. Specifically, $339.93k worth of long positions has been eliminated from the market.
This pattern suggested that traders who were optimistic about propelling DOT’s prices higher have been unable to resist the prevailing selling pressures.
If this selling pressure continues to mount among retail traders, there is a real risk that DOT could break below the critical support level of $4.001 and potentially plummet to $2.00.
Indicators signal further declines
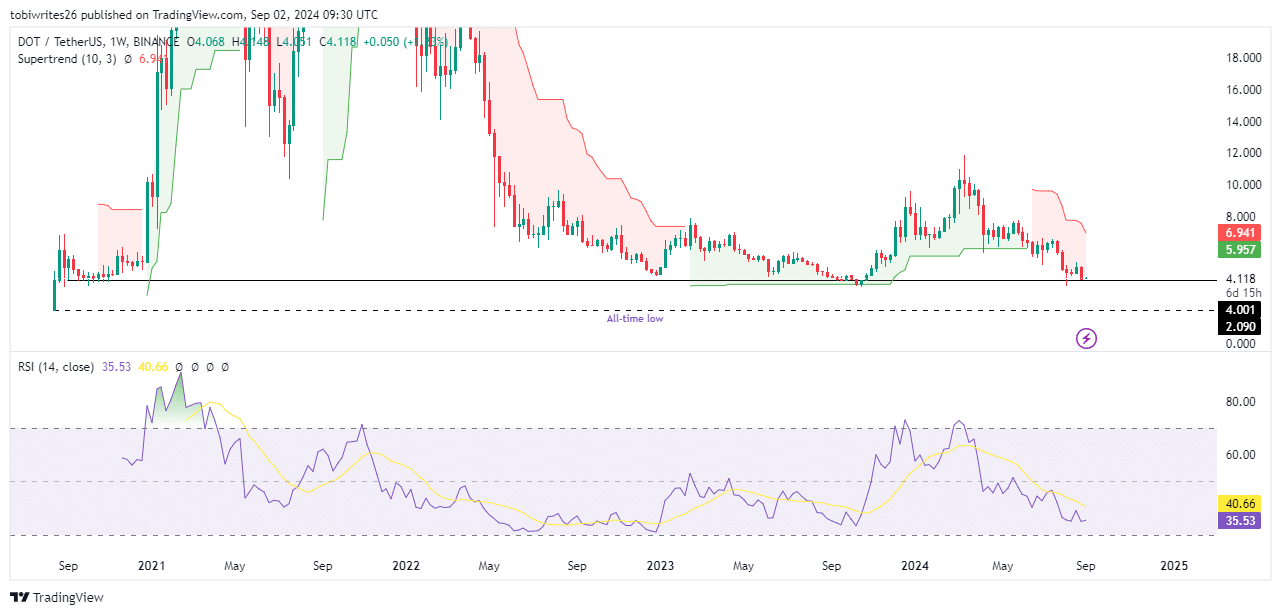
Further analysis, using the Super Trend and Relative Strength Index (RSI), indicated a likely decline in DOT’s price.
The Super Trend is a trend-following indicator that combines price movement data with the average true range to determine market direction.
It currently signals a downtrend for DOT, as the price remains below the indicator line, suggesting bearish conditions.
Read Polkadot’s [DOT] Price Prediction 2024–2025
Meanwhile, the RSI, which measures the speed and change of price movements, also forecasted a drop. With an RSI reading of 35.52 and trending downward, intensified selling pressure could push DOT’s price even lower.
These combined indicators point to a potential continuation of the current selling trend, driving the price to $2.000 and lower.