Will Shiba Inu rally beyond $0.0000259? A look at SHIB’s state
Shiba Inu fails to break out of a bullish flag pattern, but there are chances that the trend will change.

- SHIB got rejected near its resistance at $0.0000259.
- Most metrics looked bearish, but a few market indicators suggested otherwise.
A few days ago, Shiba Inu [SHIB] broke above a bullish pattern that hinted at a bull rally. However, things on the ground turned out to be different, as SHIB’s price action remained less volatile.
Let’s take a look at SHIB’s current state to understand what’s going on.
Shiba Inu remains stagnant
AMBCrypto’s analysis of Shiba Inu’s price chart revealed that the meme coin had broken above a bullish flag pattern on the 14th of May.
The pattern emerged on the meme coin’s chart in March, and since then, SHIB has consolidated inside it. Generally, a breakout above a bullish flag pattern hits a massive uptrend.
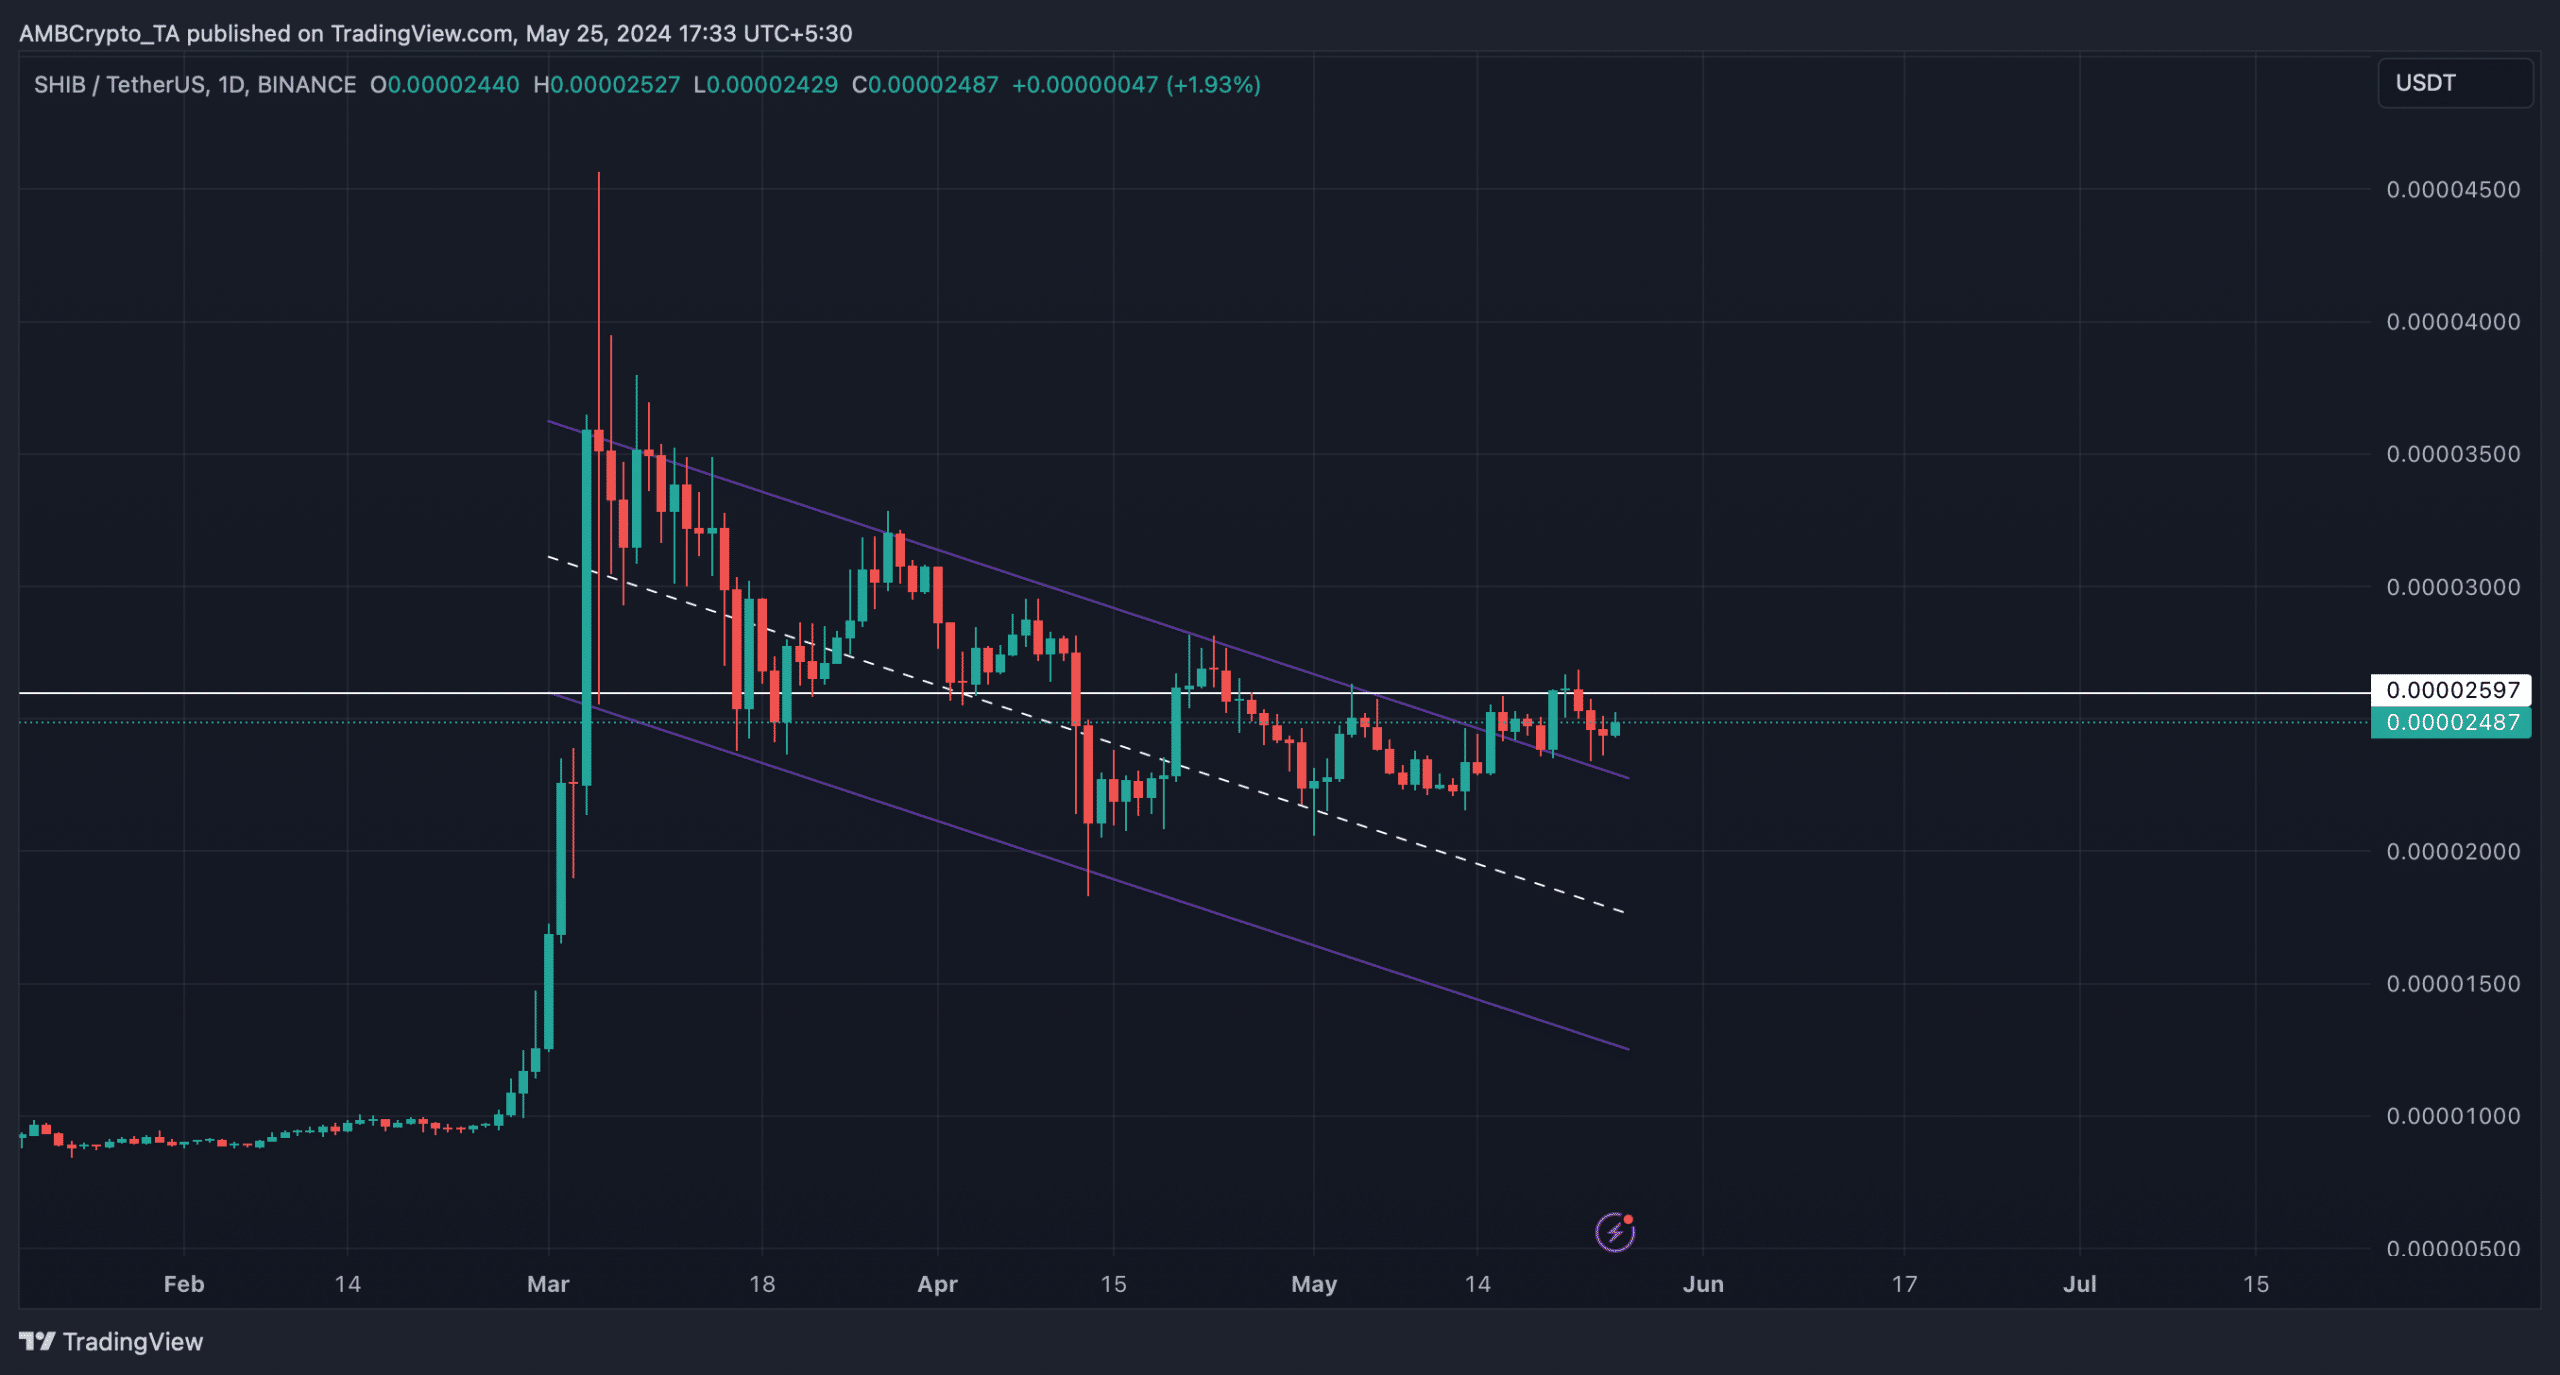
However, the case was different with SHIB, as it remained less volatile. We found that SHIB got rejected near its resistance at $0.0000259, causing its price to remain less volatile.
If SHIB manages to turn that resistance into support, then the meme coin might begin its journey towards its March high. According to CoinMarketCap, SHIB’s price dropped by over 1% in the last seven days.
At the time of writing, Shiba Inu was trading at $0.00002473 with a market capitalization of over $14.57 billion.
What to expect from SHIB
AMBCrypto then analyzed the meme coin’s on-chain metrics to see whether the bearish trend would change.
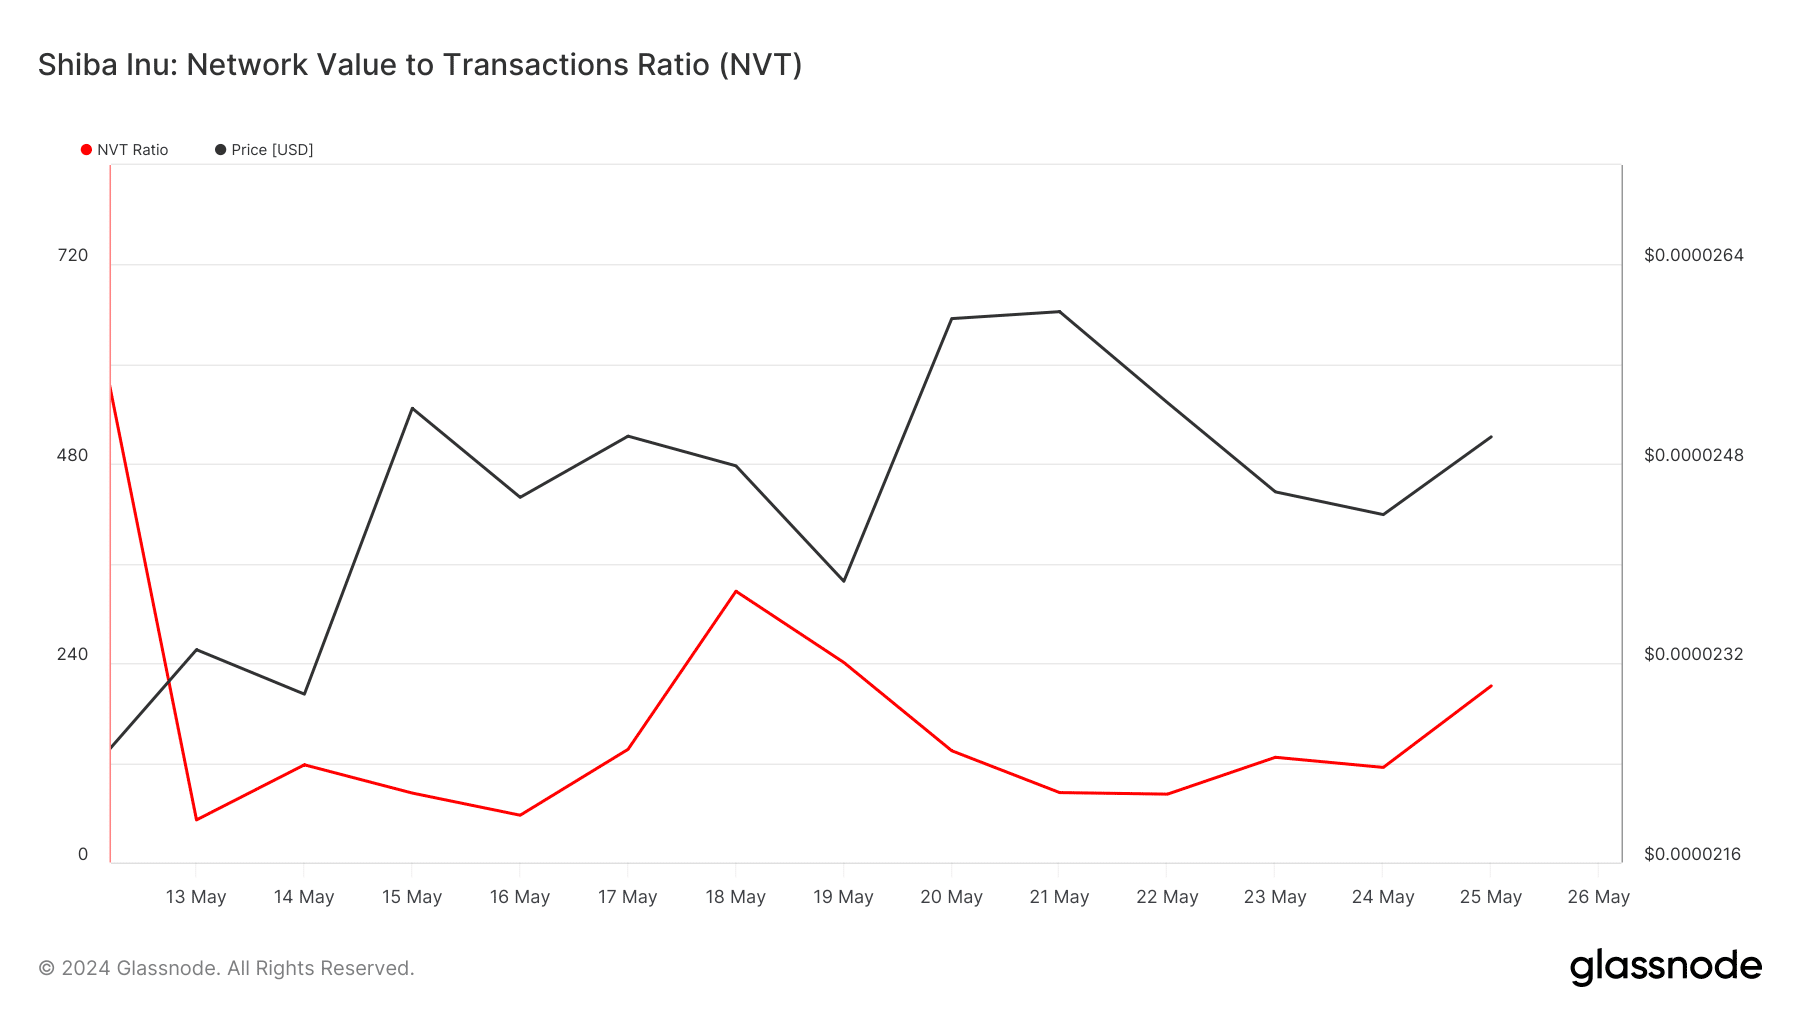
Our analysis of Glassnode’s data revealed that after a sharp drop, SHIB’s NVT ratio registered a slight uptick. A hike in the metric suggested that Shiba Inu was overvalued.
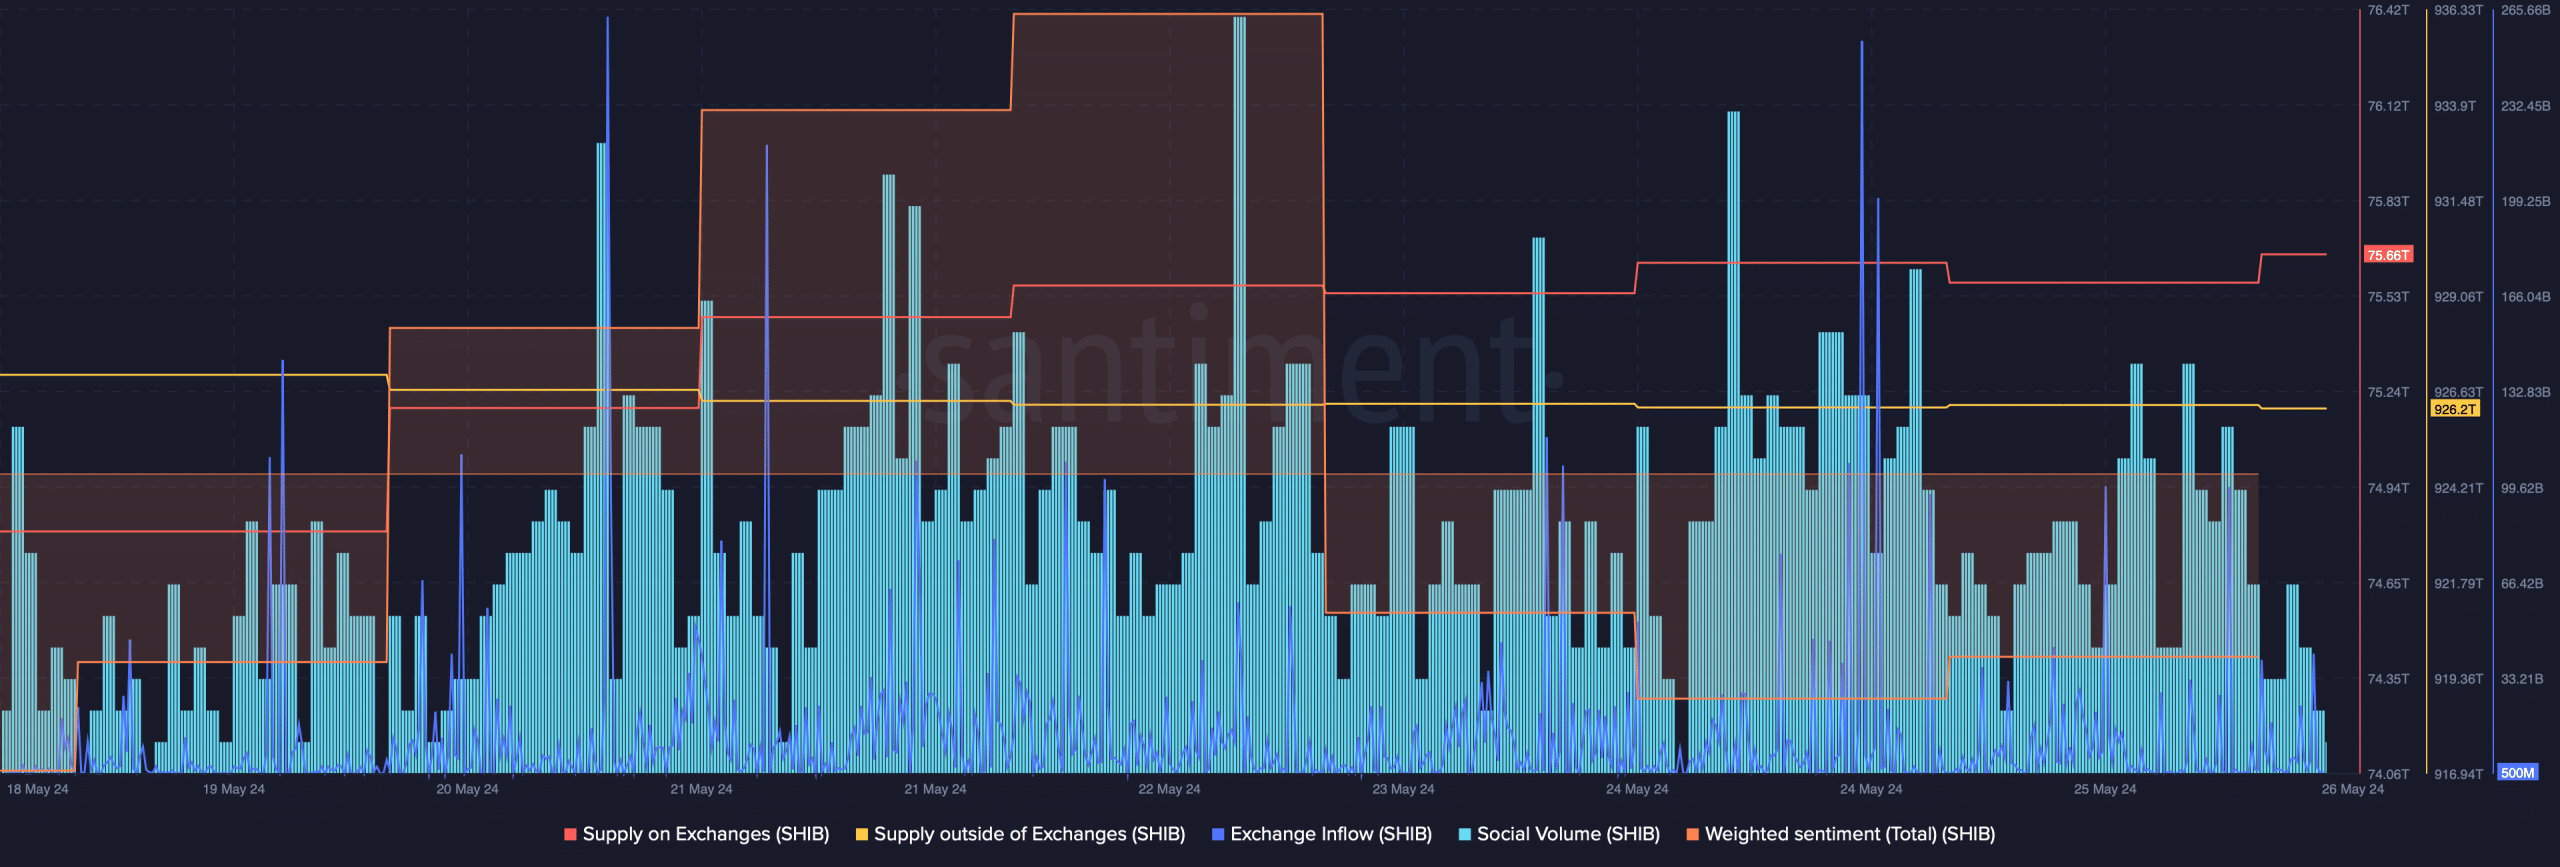
The bad news was that selling pressure on the meme coin increased over the last week. Santiment’s data revealed that SHIB’s Exchange Inflow increased substantially.
The meme coin’s Supply on Exchanges increased, while its Supply outside of Exchanges dropped. This clearly indicated that investors were selling their holdings.
Apart from this, investors’ confidence in SHIB also dwindled as its Weighted Sentiment dropped. This indicated that bearish sentiment around it was dominant.
Nonetheless, SHIB’s Social Volume remained high, reflecting the meme coin’s popularity.
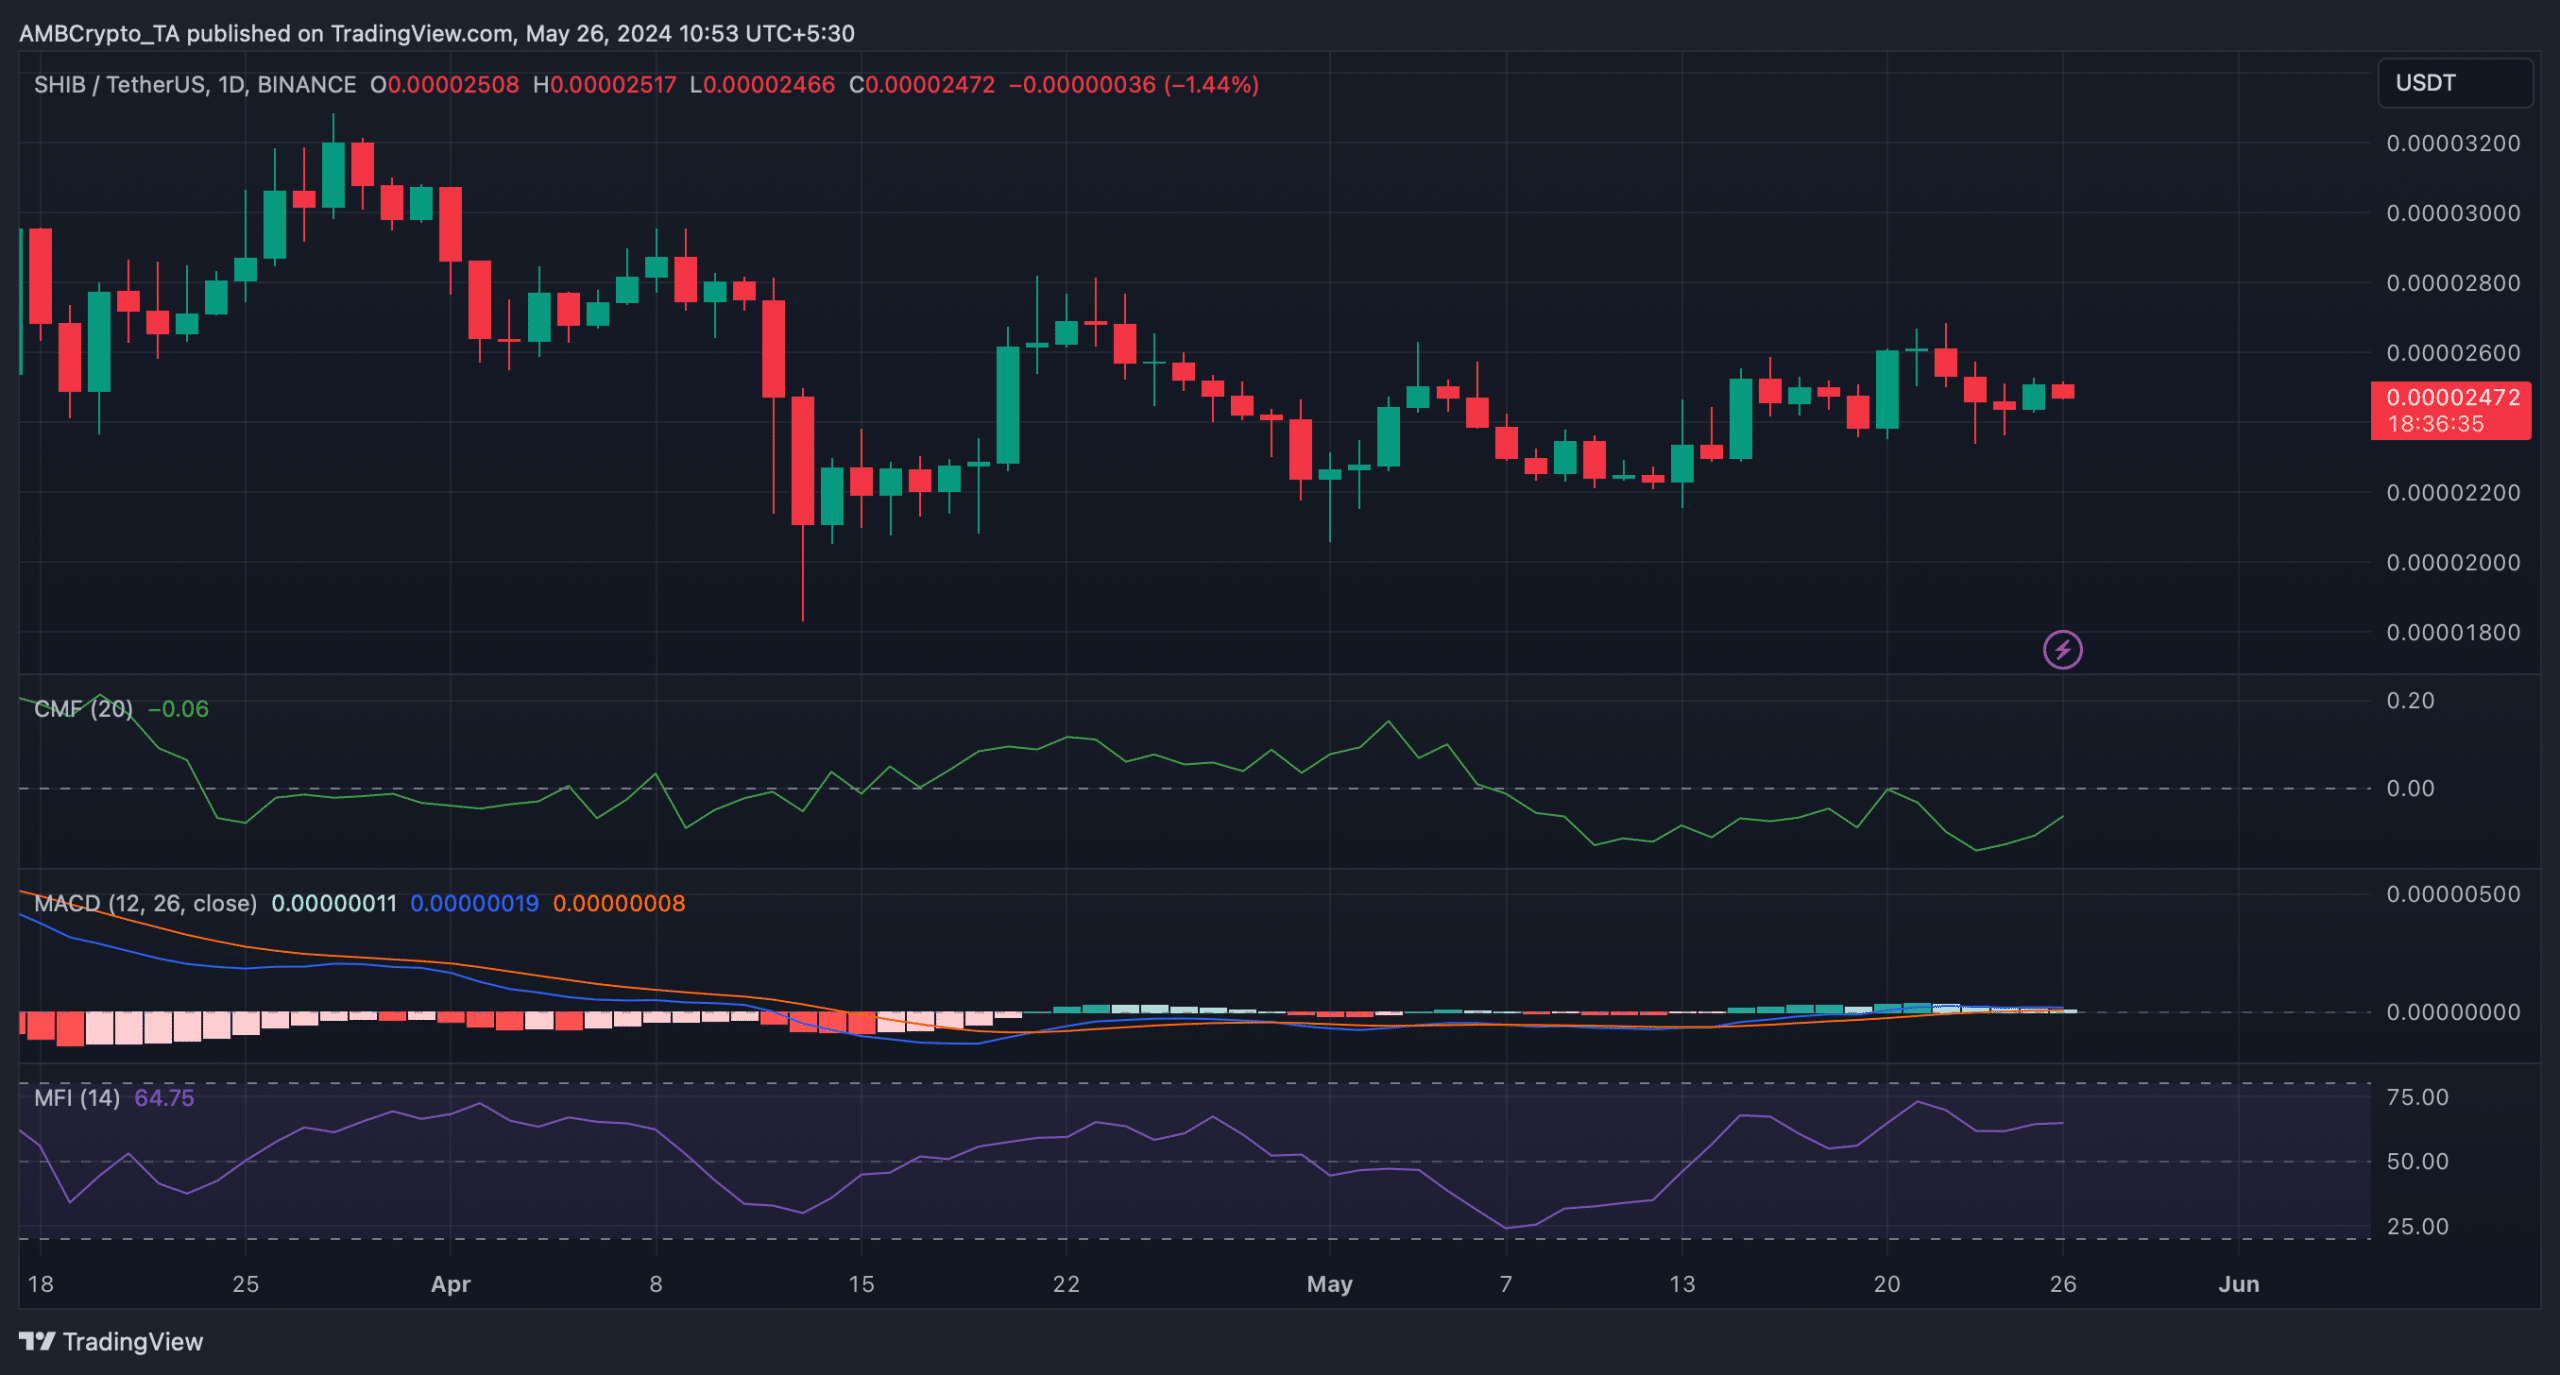
We then took a look at SHIB’s daily chart to see what the indicators suggested. As per our analysis, SHIB’s MACD indicated that the bulls and bears were at a war to get an advantage over each other.
Read Shiba Inu’s [SHIB] Price Prediction 2024-2025
The Money Flow Index (MFI) also had a similar reading, as it went sideways over the last few days.
Nonetheless, the Chaikin Money Flow (CMF) indicated that the bulls might turn out to be victorious, as it registered a sharp uptick.