Analysis

Will Stellar Lumens [XLM] have a decent pullback before pumping toward the $0.1 mark? Decoding…
Posted:
Journalist
![Will Stellar Lumens [XLM] have a decent pullback before pumping toward the $0.1 mark? Decoding...](https://ambcrypto.com/wp-content/uploads/2023/01/PP-2-XLM-cover-e1673874280723.jpg.webp)
Disclaimer: The information presented does not constitute financial, investment, trading, or other types of advice and is solely the writer’s opinion.
- The market structure was strongly bullish on the higher timeframes.
- A fair value gap lay below and above the price.
Bitcoin [BTC] trended upward throughout the past week and ran as high as $21.5k before encountering a significant number of sellers. Though the long-term trend of the market has been downward, Bitcoin undoubtedly had huge bullish momentum after its break above the $17.8k level.
Read Stellar Lumens’ [XLM] Price Prediction 2023-24
The altcoin market also saw capital flow inward, and Stellar Lumens [XLM] noted gains of 25% in the past ten days. The price charts showed that another move upward was likely, although buyers can wait for a pullback to an area of interest.
A dip to the $0.083 zone would be welcomed by the buyers due to the Fibonacci levels
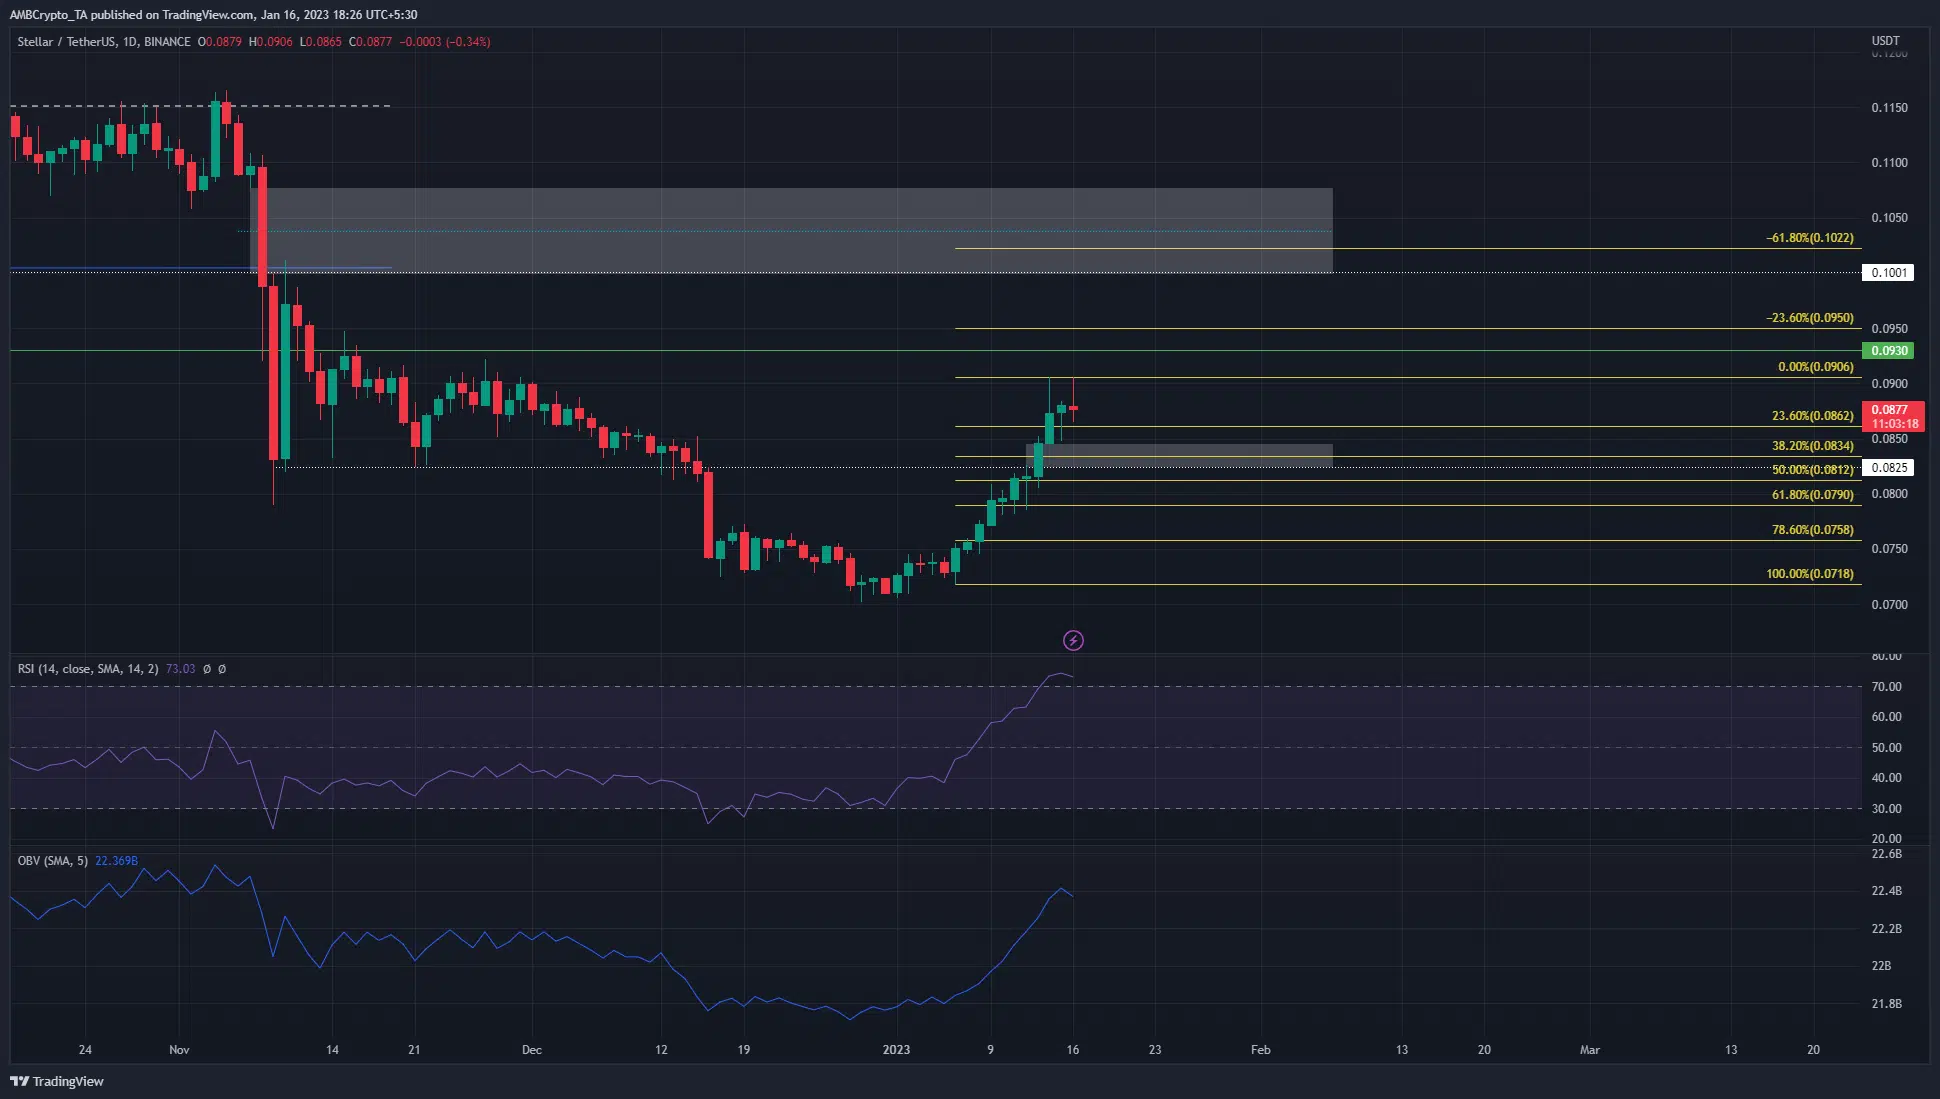
Source: XLM/USDT on TradingView
Based on the move upward from $0.071 to $0.09, a set of Fibonacci retracement levels was plotted. The 38.2% retracement level sat at $0.083, with a significant level of support at $0.082 as well. Moreover, a fair value gap (highlighted by the white box) was also noted in this zone.
Therefore, bullish market participants can look for a pullback into this zone to buy XLM. The confluence of multiple support zones suggested that the probability of a bounce in prices from this area was good. The lower timeframe charts showed that the $0.082-$0.085 areas saw some consolidation in mid-December.
Once more, this marked the zone as an area of interest.
How many are 100 XLM worth today?
To the north, the daily chart showed a large inefficiency left behind on the charts from $0.1-$0.108. Bulls can look to take profit at a 50% fill of this FVG at $0.104. The 61.8% extension level at $0.1022 can also be used to take profits. Moreover, the RSI and OBV noted large gains, indicating hefty bullish pressure.
The rising Open Interest was evidence of bullish conviction
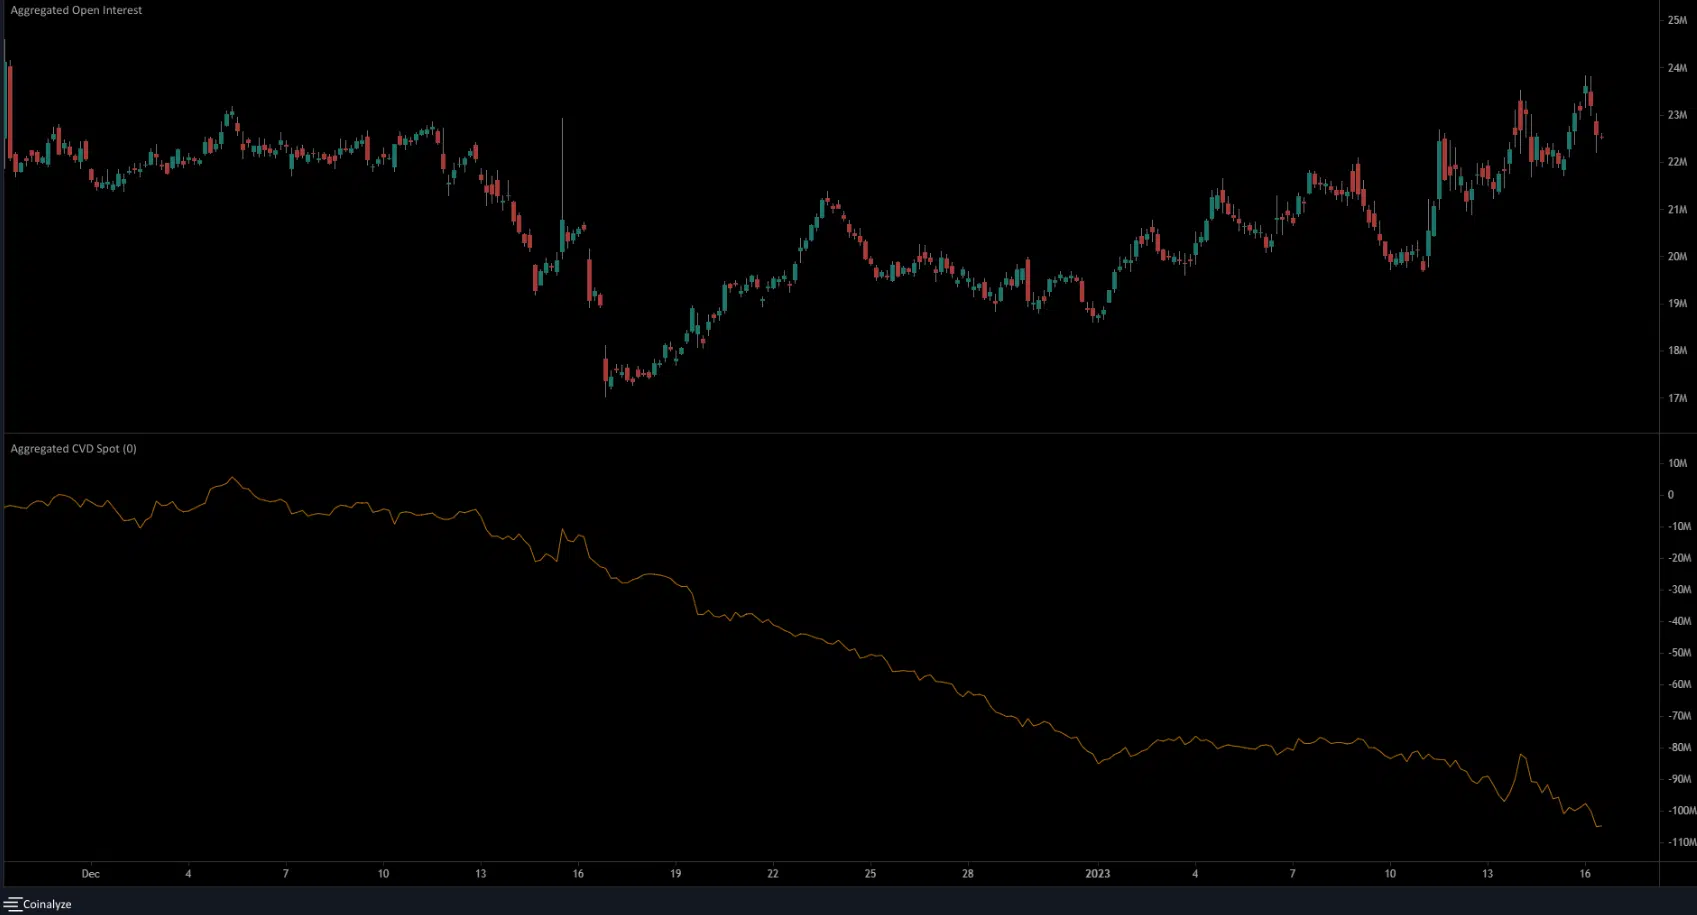
Source: Coinalyze
Throughout January, the Open Interest metric has steadily ticked upward. This showed that money has flowed into the market. While we do not know how many positions were long or short, it was still enough to conclude that rising prices and OI pointed toward bullish intent.
However, unlike the OBV, the spot CVD has been declining behind Stellar Lumens. Even though the price trended upward, the inference was continued selling pressure. Could this mean a reversal was imminent? A daily session close below $0.081 can be taken as an invalidation of the bullish idea laid out above.

![Why Chainlink [LINK] and Polygon [MATIC] are more similar than you realise](https://ambcrypto.com/wp-content/uploads/2024/04/Chainlink_and_Polygon-1-400x240.webp)