- The charts of SUI and SEI resembled SOL before its 2021 bull run.
- The TVL is growing for all, but which is a better fit for investment?
The altcoin market is booming, with several top-performing cryptocurrencies gaining momentum. Two of the standout performers over the last 90 days are SUI Network [SUI] and Sei [SEI], both showing significant gains.
SUI has surged over 109%, while SEI has risen by 31%, placing them among the top 10 performers for this period.
As blockchain technology continues to advance, SUI and SEI are poised for further growth in Q4 2024, drawing comparisons to Solana’s [SOL] rally in 2021.

Source: X
Charts resemble Solana’s 2021 pattern
When comparing their charts with Solana’s, a striking resemblance emerges. Solana’s 2021 chart pattern, which led to its massive 2,500% rally, mirrored the current patterns forming for SUI and SEI.
SUI’s fast transaction speed, though still theoretical, has contributed to its market outperformance.
Like Solana in 2021, both SUI and SEI have formed early highs and lows, and if market conditions remain favorable, these two assets could see similar gains.

Source: X
In Solana’s case, it experienced a high in early Q3 2021, dipped in late Q3, and then skyrocketed by over 2,500%. SUI and SEI are following this same pattern, suggesting potential for major upward price movement.
TVL comparison for the three assets
Looking at the total value locked (TVL) across these assets, Solana leads in total value locked (TVL) with $5.306 billion, far ahead of SUI and SEI, which are relatively new.
SUI ranks second with $1.116 billion in TVL, surpassing Polygon (POL). SEI’s $534 million lags behind as it is half of SUI’s TVL. This makes SUI more appealing than SEI for investors and traders seeking strong trade opportunities.

Source: DefiLlama
Despite SUI’s and SEI’s recent market entry, they show potential, but Solana remains the clear frontrunner in terms of attracting value to its ecosystem, giving it a competitive edge in the market.
SUI vs SEI performance comparison
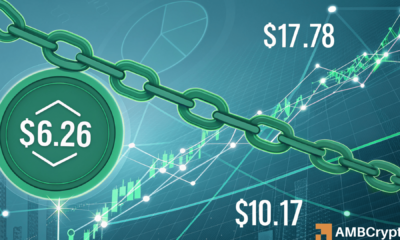
In terms of overall market performance, SUI’s current price trades at $1.75, SEI at $0.40, and Solana at $148.
The market cap of SUI is approximately four times higher than that of SEI, standing at $4.69 billion compared to SEI’s $1.4 billion.
This indicates that SUI may be the stronger investment opportunity between the two. SUI’s price has increased by 297% year-to-date, slightly ahead of SEI’s 286% gain.
However, over the last month, SUI has seen an 82% rise, far outpacing SEI’s 33% gain, positioning SUI as the more promising asset for Q4.

Source: Coinpare
SUI and SEI both exhibit strong growth potential, with SUI taking the lead in terms of market performance, TVL, and overall investor sentiment.
Read Sui’s [SUI] Price Prediction 2024–2025
Both assets resemble Solana’s 2021 chart pattern, which suggests they could experience significant gains if market conditions remain favorable.
SUI appears to be the more favorable investment option, given its higher price growth, market cap, and TVL, making it well-positioned for a potential rally similar to Solana’s.