Will Toncoin [TON] fall below $6 in the next 7 days?
TON’s price is on the verge of breaking out of a bull pattern, but its price action has turned bearish.
![Will Toncoin [TON] fall below $6 in the next 7 days?](https://ambcrypto.com/wp-content/uploads/2024/05/Toncoin-turns-bearish.webp)
- Toncoin’s price declined by nearly 3% in the last 24 hours.
- Most metrics and market indicators looked bearish on TON.
Toncoin [TON] bears have dominated the market in the last week as the token’s price charts remained red.
The recent downtick looked bearish as it pushed TON’s price down from a key resistance, which otherwise would have sparked a bull rally.
Toncoin bears step up
CoinMarketCap’s data revealed that Toncoin bears clearly controlled the market, as the token’s price dropped by nearly 3% in the last 24 hours.
At the time of writing, TON was trading at $6.31 with a market capitalization of over $21.9 billion.
While the token’s price turned bullish, it was consolidating in a bullish falling wedge pattern.
World of Charts, a popular crypto analyst, posted a tweet highlighting this development as TON’s price was near the upper limit of the pattern.
As per the tweet, a breakout from the pattern might kickstart a bull rally that would allow TON to surge by 25%.
However, the current price trend suggests that TON might not manage to break above. Therefore, AMBCrypto analyzed Toncoin’s on-chain metrics to better understand which way the token was headed.
What to expect from TON?
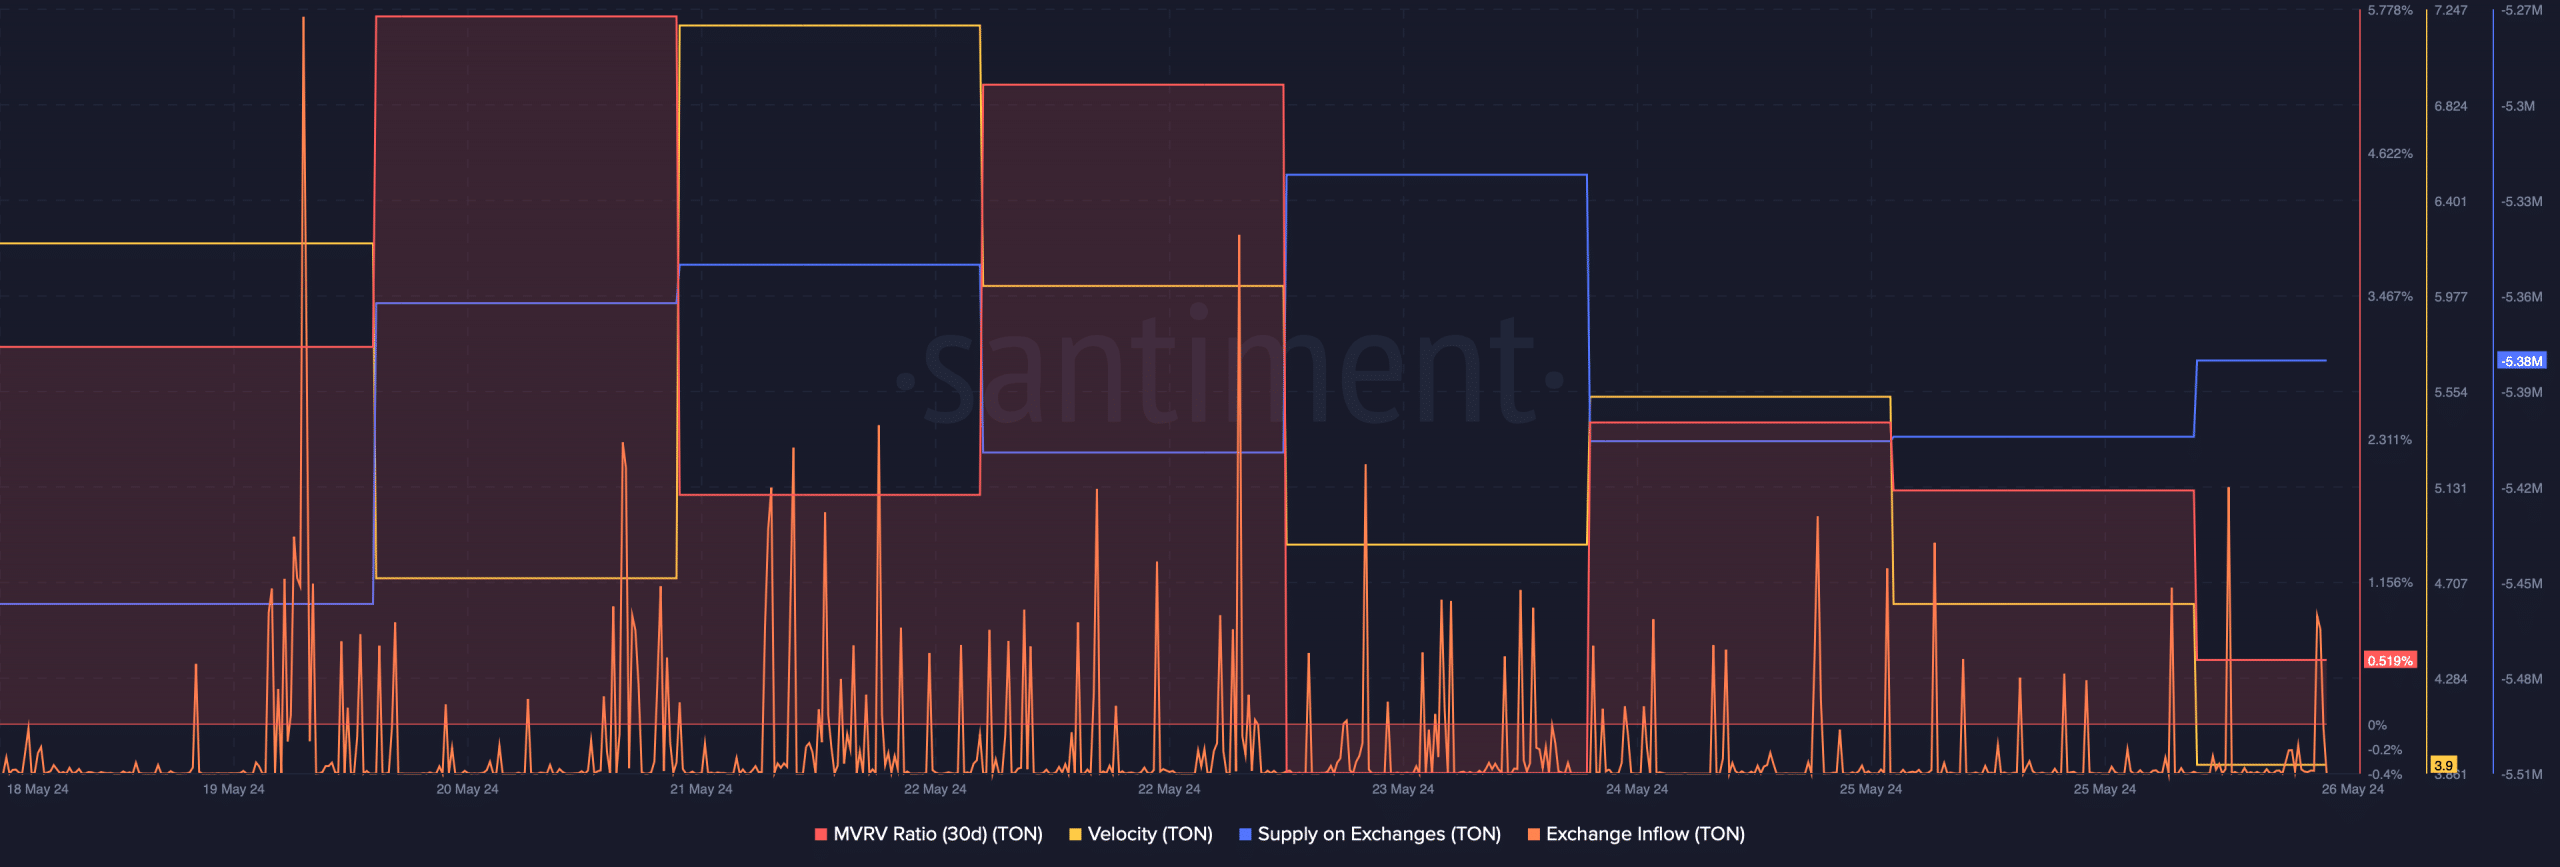
AMBCrypto’s analysis of Santiment’s data revealed that TON’s Exchange Inflow increased over the last week, indicating high selling pressure.
The token’s Supply on Exchanges also dropped alongside its Velocity, further proving the fact that investors were selling TON. This meant that TON was used less often in transactions within a set timeframe.
Another bearish metric was the MVRV ratio, which registered a decline over the last few days.
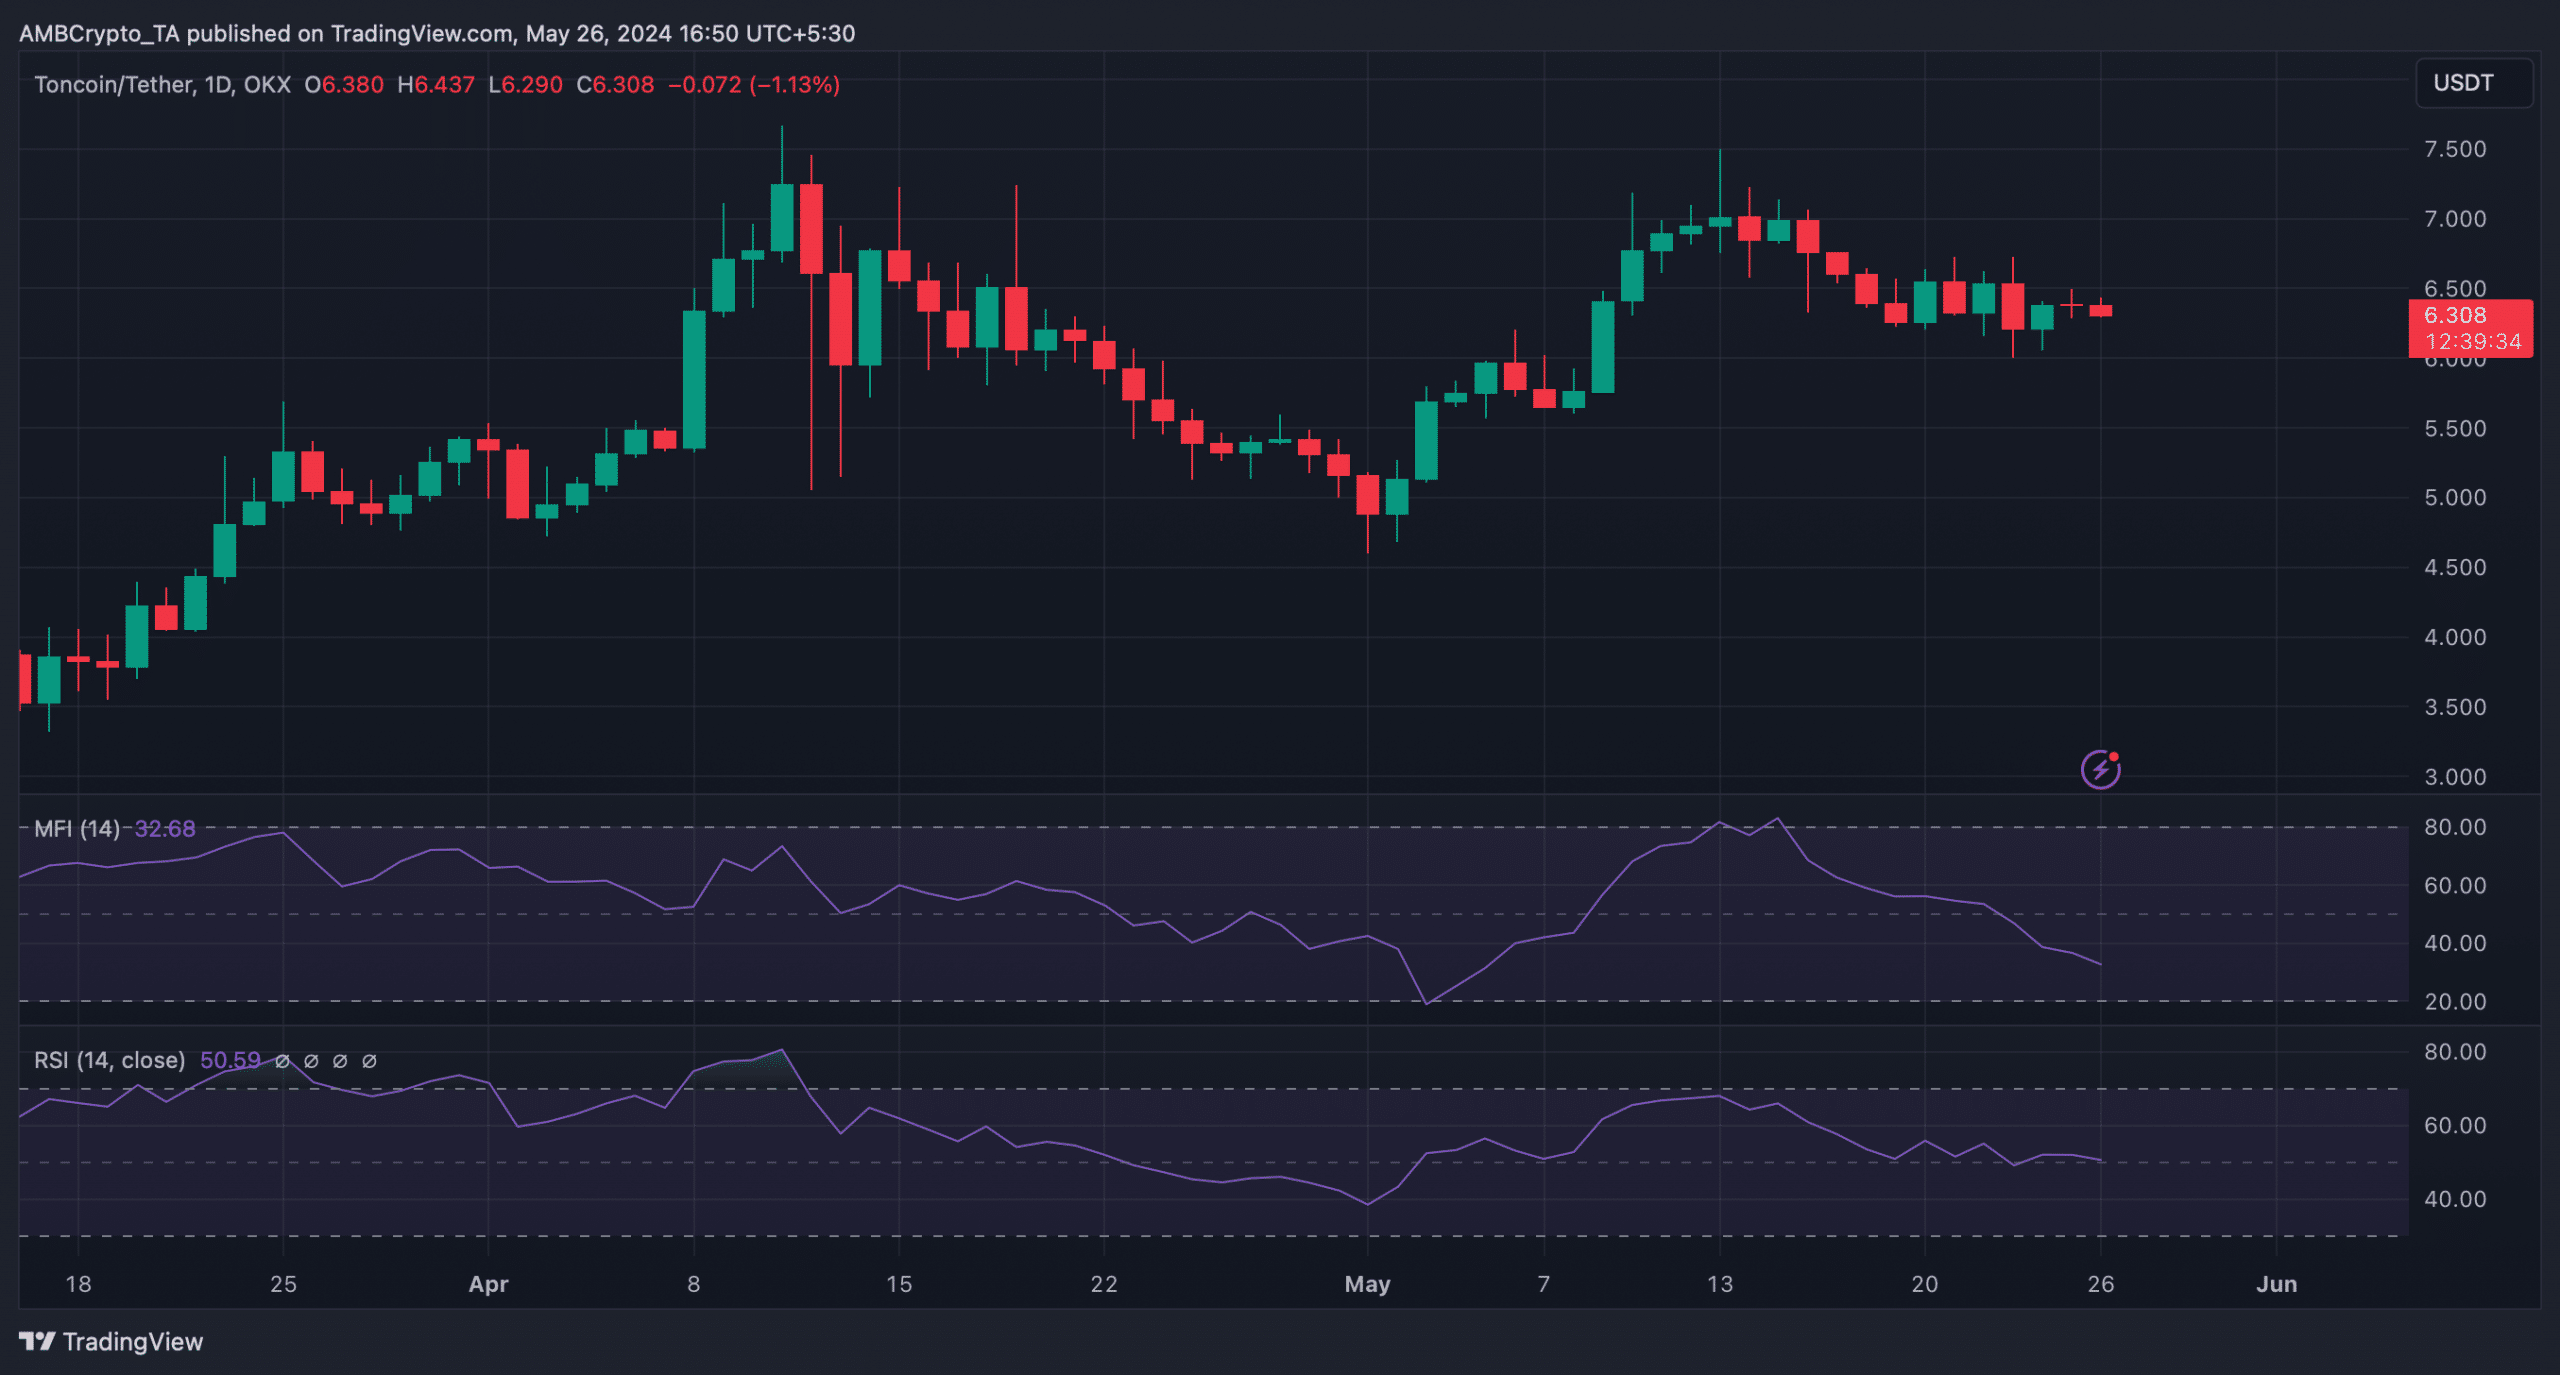
AMBCrypto’s look at TON’s daily chart revealed quite a few bearish indicators. For example, the Money Flow Index (MFI) registered a sharp downtick.
The Relative Strength Index (RSI) also followed a similar declining trend. These technical indicators suggested that the chances of the bearish price trend continuing further were high.
If this turns out to be true, then investors might witness TON to touch $5.9 in the coming days, as it has strong support there. A plummet under that could push the token’s value further down to $5.3–$5.
Is your portfolio green? Check out the TON Profit Calculator.
Nonetheless, if a trend reversal happens and TON breaks above the falling wedge, then it can reach new highs.
AMBCrypto reported earlier that there was a possibility of TON touching $10 in the coming days or weeks.


