Will TRX’s price follow the uptick in TRON’s network adoption?
Network activity metrics showed progressive growth in adoption.

- TRON registered a hike in transaction activity in 2025
- TRX appeared to be within a consolidation phase on the price charts
Over the past six months, the TRON network has seen a steady uptrend in daily transactions. This hinted at a strong uptick in network usage and adoption, compared to six months ago.
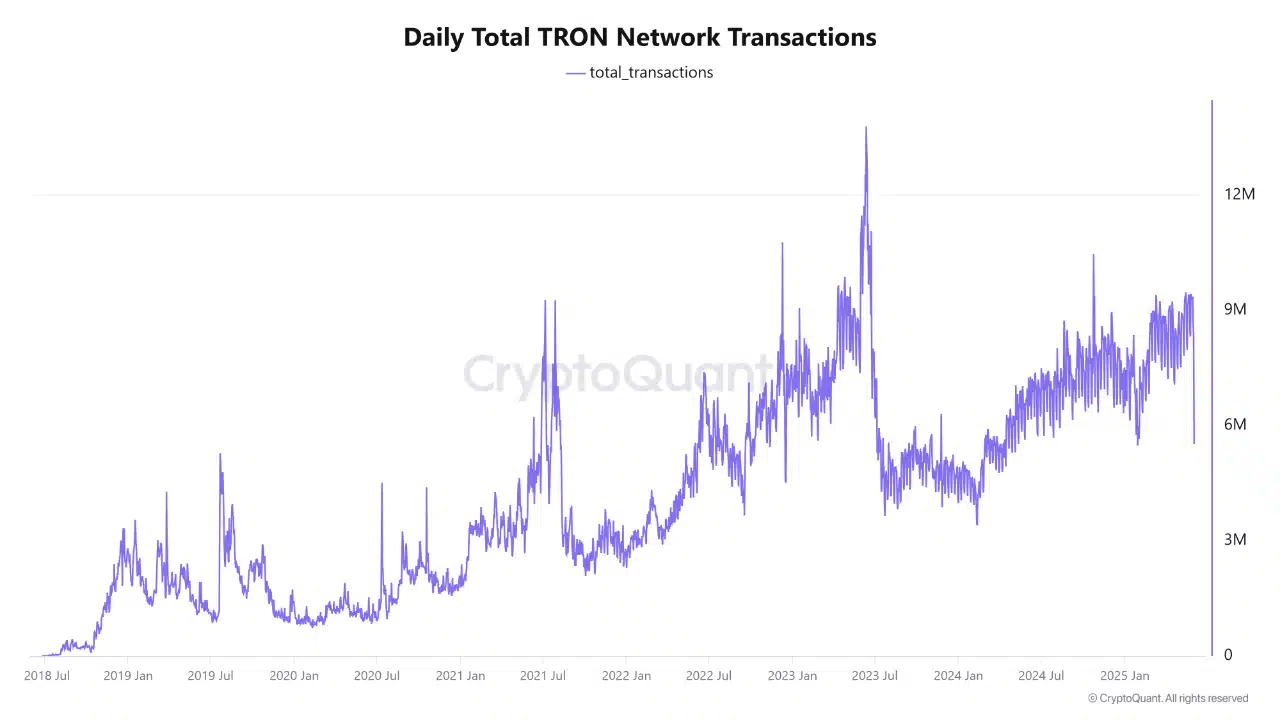
In a post on CryptoQuant Insights, on-chain analyst CryptoOnchain observed that from the beginning of 2025 up to late May, the average daily transactions ranged between 6 to 9 million.
In fact, data from Token Terminal revealed that the transaction fee for TRON has been comparable to Bitcoin’s [BTC], but much higher than the fees on Solana [SOL]. In fact, the Solana network comfortably surpassed TRON in terms of txn count too.

DeFiLlama data revealed that the Total Value Locked (TVL) on the TRON Network has been declining since December 2024. It saw a swift spike in mid-May, but recorded a commensurate decline in the last 24 hours.
On the contrary, the network usage metrics seemed to flash conflicting signals. In fact, TRX’s price action also lacked a clear trend and direction over the past two weeks.
What was the impact of greater adoption on TRX’s price?

On the 1-day chart, the momentum of TRX receded from bullish to neutral. Here, both the differences and the similarities to the first half of May need to be pointed out. Back then, the token consolidated around the $0.25 resistance zone, before shooting higher.
This resistance zone marked the mid-range level. A breakout saw the range highs tested, and another consolidation phase developed over the past two weeks.
And yet, unlike the previous breakout, when the CMF climbed above +0.05 at press time, the CMF was trending south. Its value of -0.08 signaled sizeable capital outflows from the market and a hike in selling pressure.
The A/D indicator slipped lower over the past two weeks too. Overall, it appeared that selling volume was winning. However, if Bitcoin can regain its bullish momentum, it might spark TRX bulls to claim the $0.28 area as support and push towards the $0.3-retracement level.