
FARTCOIN drops 21% – Why price recovery hinges on THIS demand zone

- USDT led the market at press time, with a commanding 70% share
- At the same time, Bitcoin tested the crucial $60k support level.
Tether [USDT] commanded the stablecoin market with a commanding 70% share at press time, while USDC held the second spot at 20.8%.
So, with a total market capitalization of $168 billion, stablecoins make up 8.2% of the entire cryptocurrency market.
Just as USDT reigns supreme among stablecoins, Bitcoin [BTC] continues to dominate the broader crypto landscape.
Given their substantial roles, any major movements by either could send ripples across the entire crypto world, making their activities a key area of interest for AMBCrypto.
USDT dominance could temper Bitcoin’s surge
Bitcoin last tested the $60,000 support level on the 8th of August, but bulls couldn’t hold the price. Since then, it has been consolidating for ten days straight.
However, a crucial bullish push has lifted Bitcoin out of consolidation, with its current price at $60,941.
Meanwhile, AMBCrypto’s analysis of a post by the data analytics platform Alphractal on X (formerly Twitter) uncovered a correlation between Bitcoin and stablecoins.
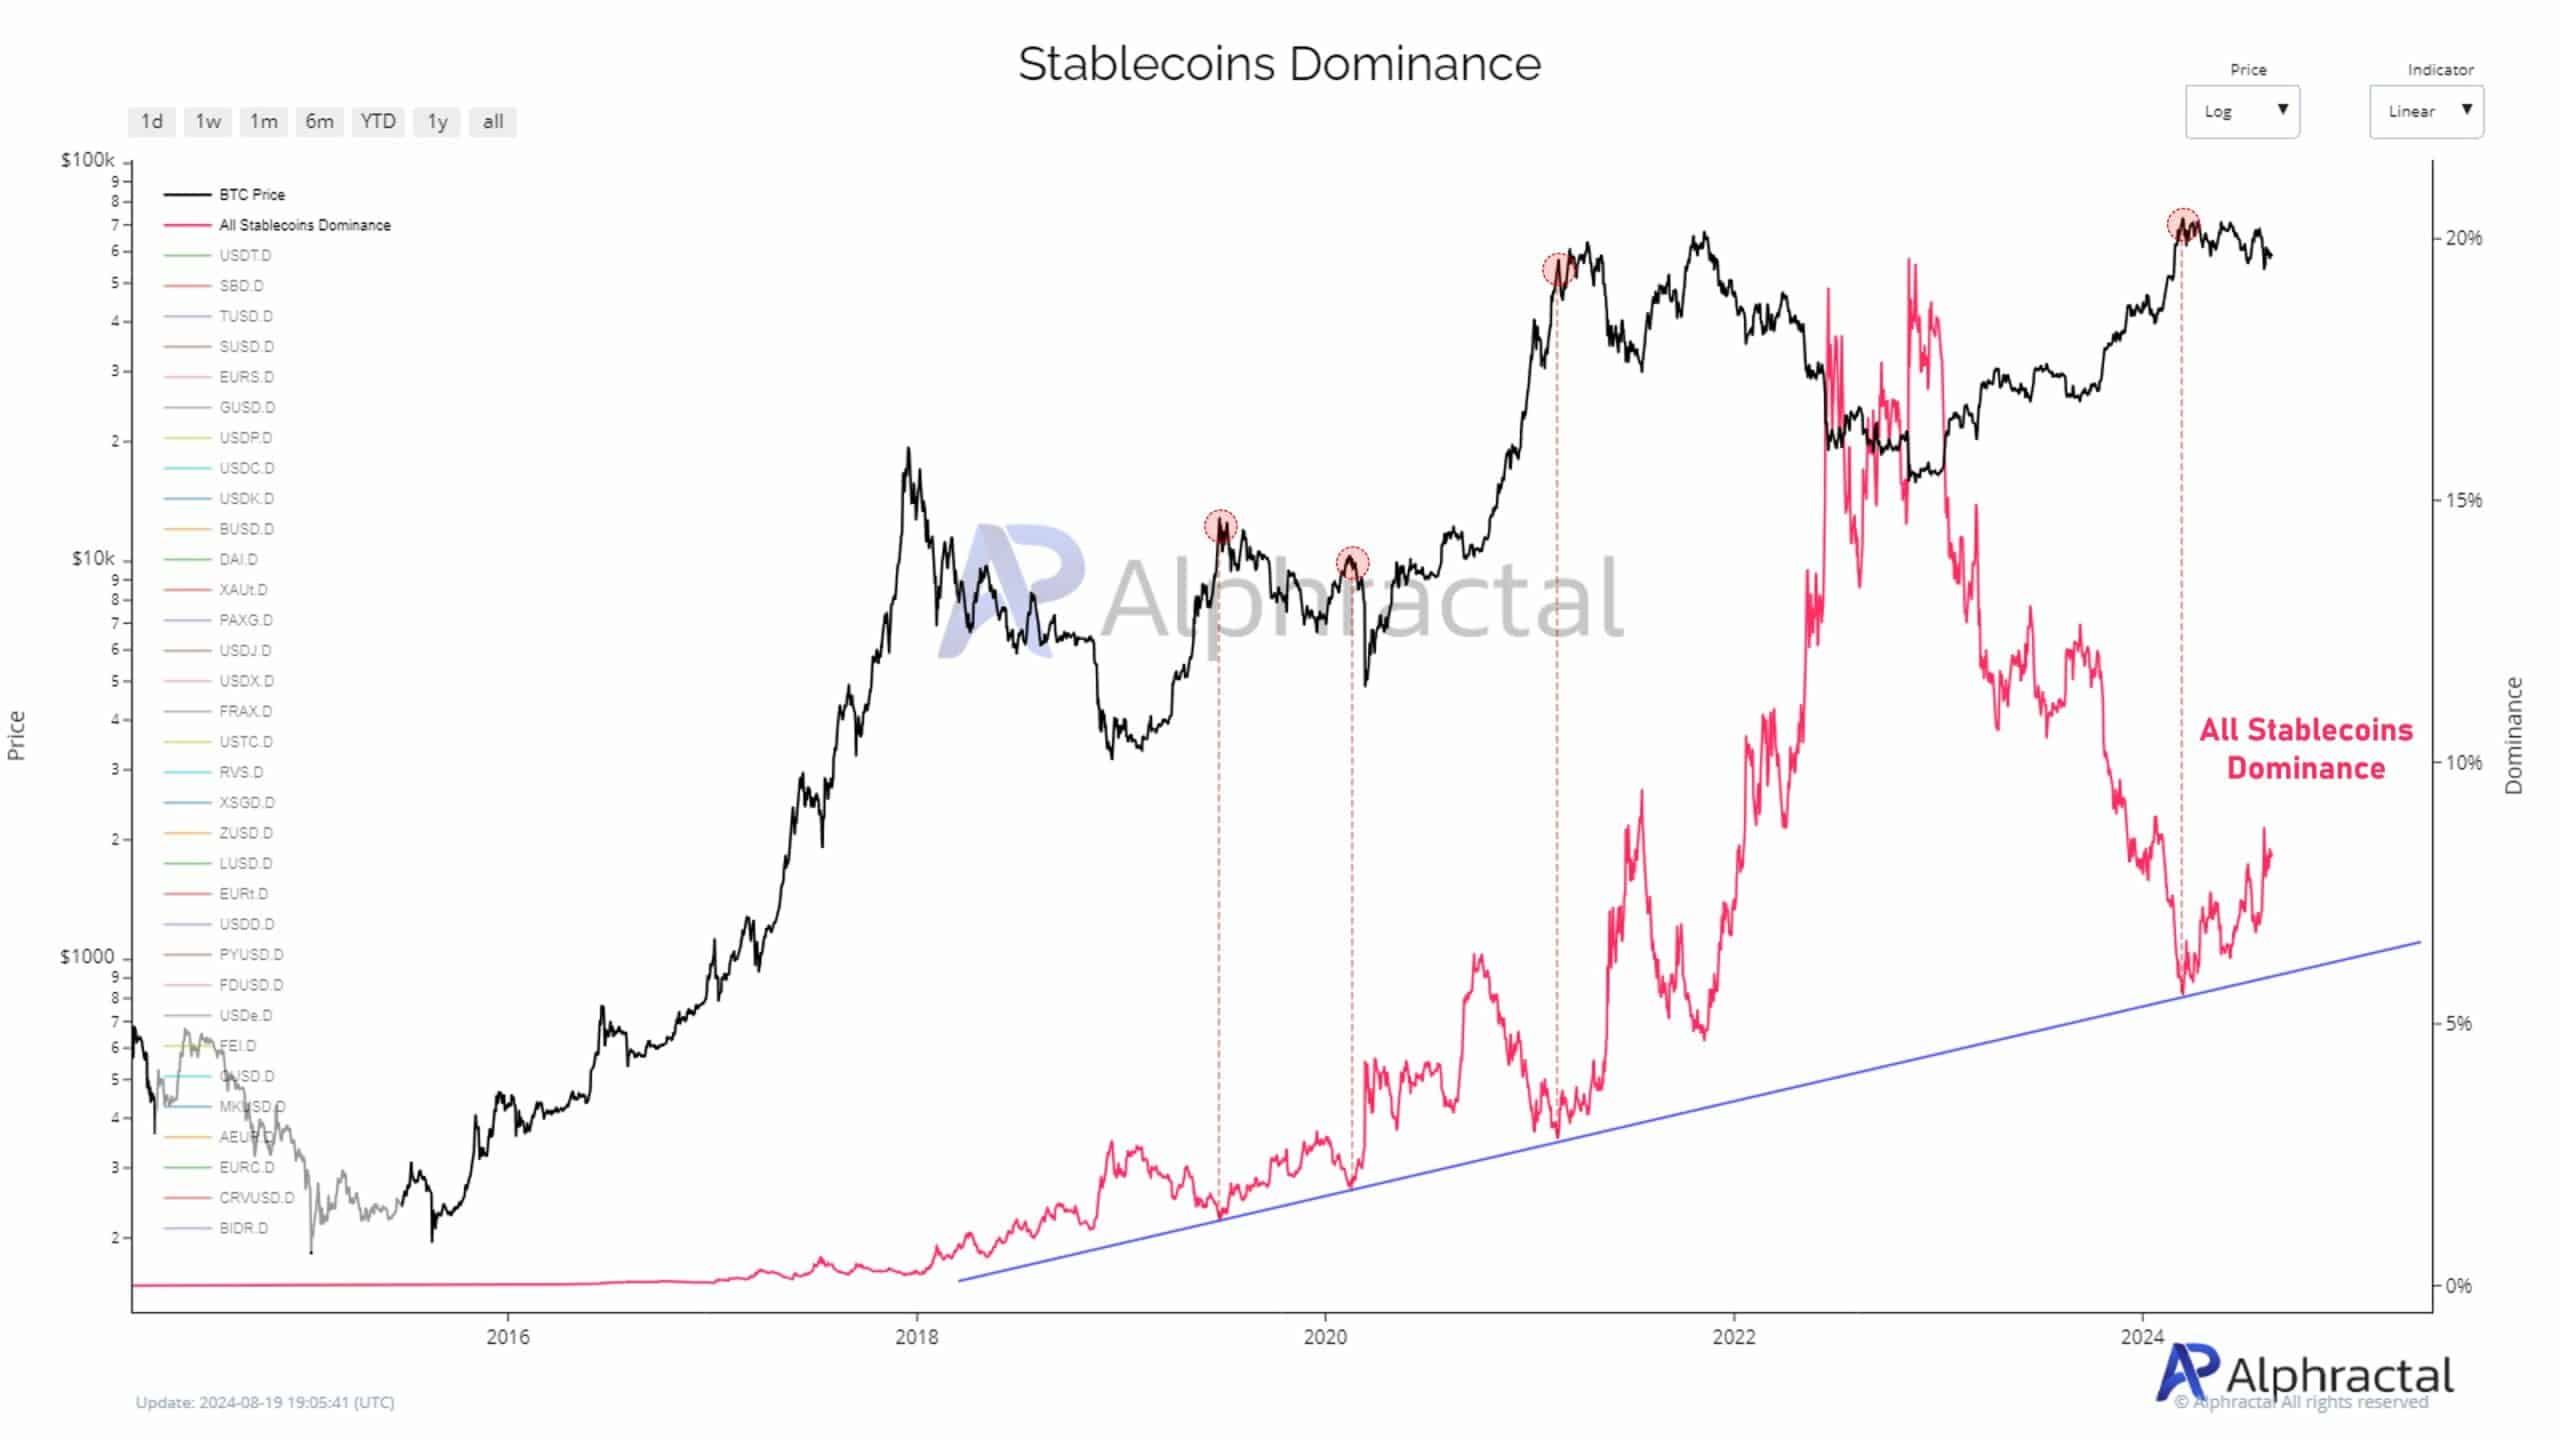
Source : Alphractal /X
Historically, whenever Bitcoin has tested a key resistance level, it has coincided with an increase in stablecoin dominance.
Put simply, this suggests that investors might be turning cautious. By converting their holdings to stablecoins, they protect themselves from Bitcoin’s volatility.
In a separate analysis, AMBCrypto explored whether the high USDT dominance could potentially reverse engineer Bitcoin into a downward trend. The study revealed the following insights.
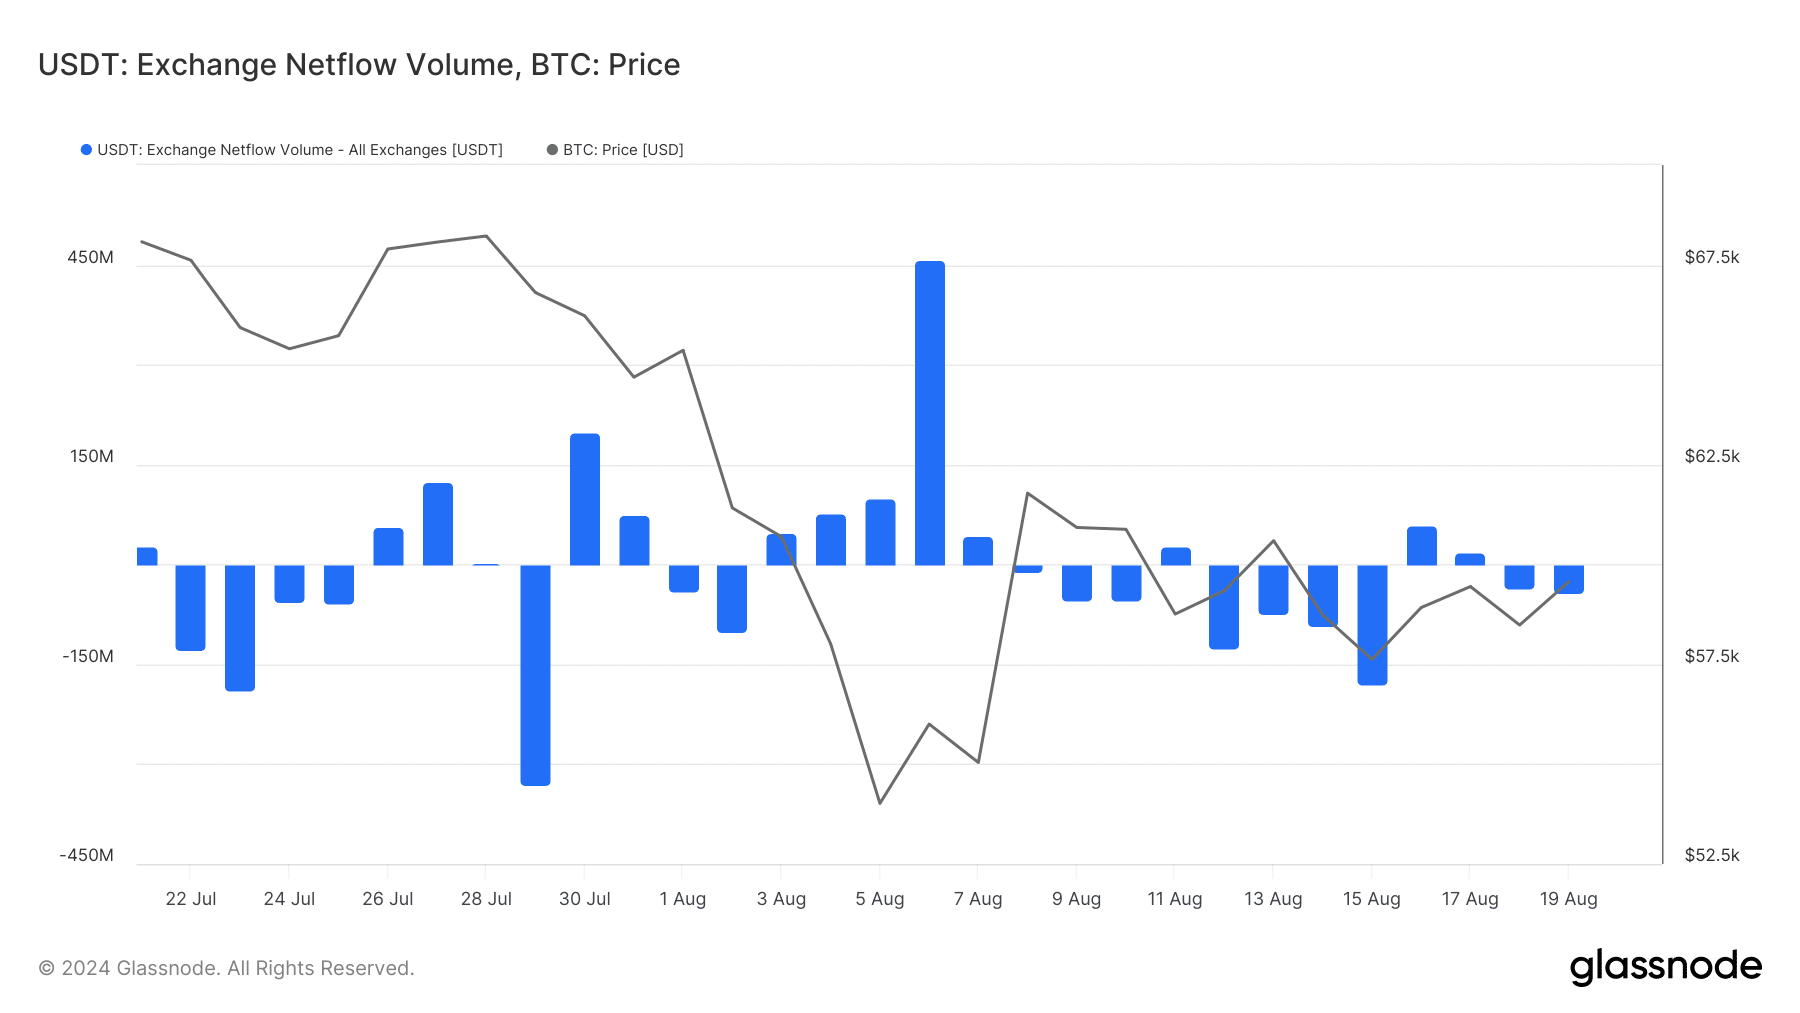
Source : Glassnode
On the one-month chart, the total exchange net flow of USDT slipped into the negative zone, indicating that more USDT was being withdrawn from exchanges than deposited.
As of the 9th of August, approximately 41 million USDT flowed out of exchanges, a notable increase from the previous day’s 35 million.
If this trend continues, it could dampen Bitcoin’s price surge, potentially preventing it from breaching the $62k resistance level.
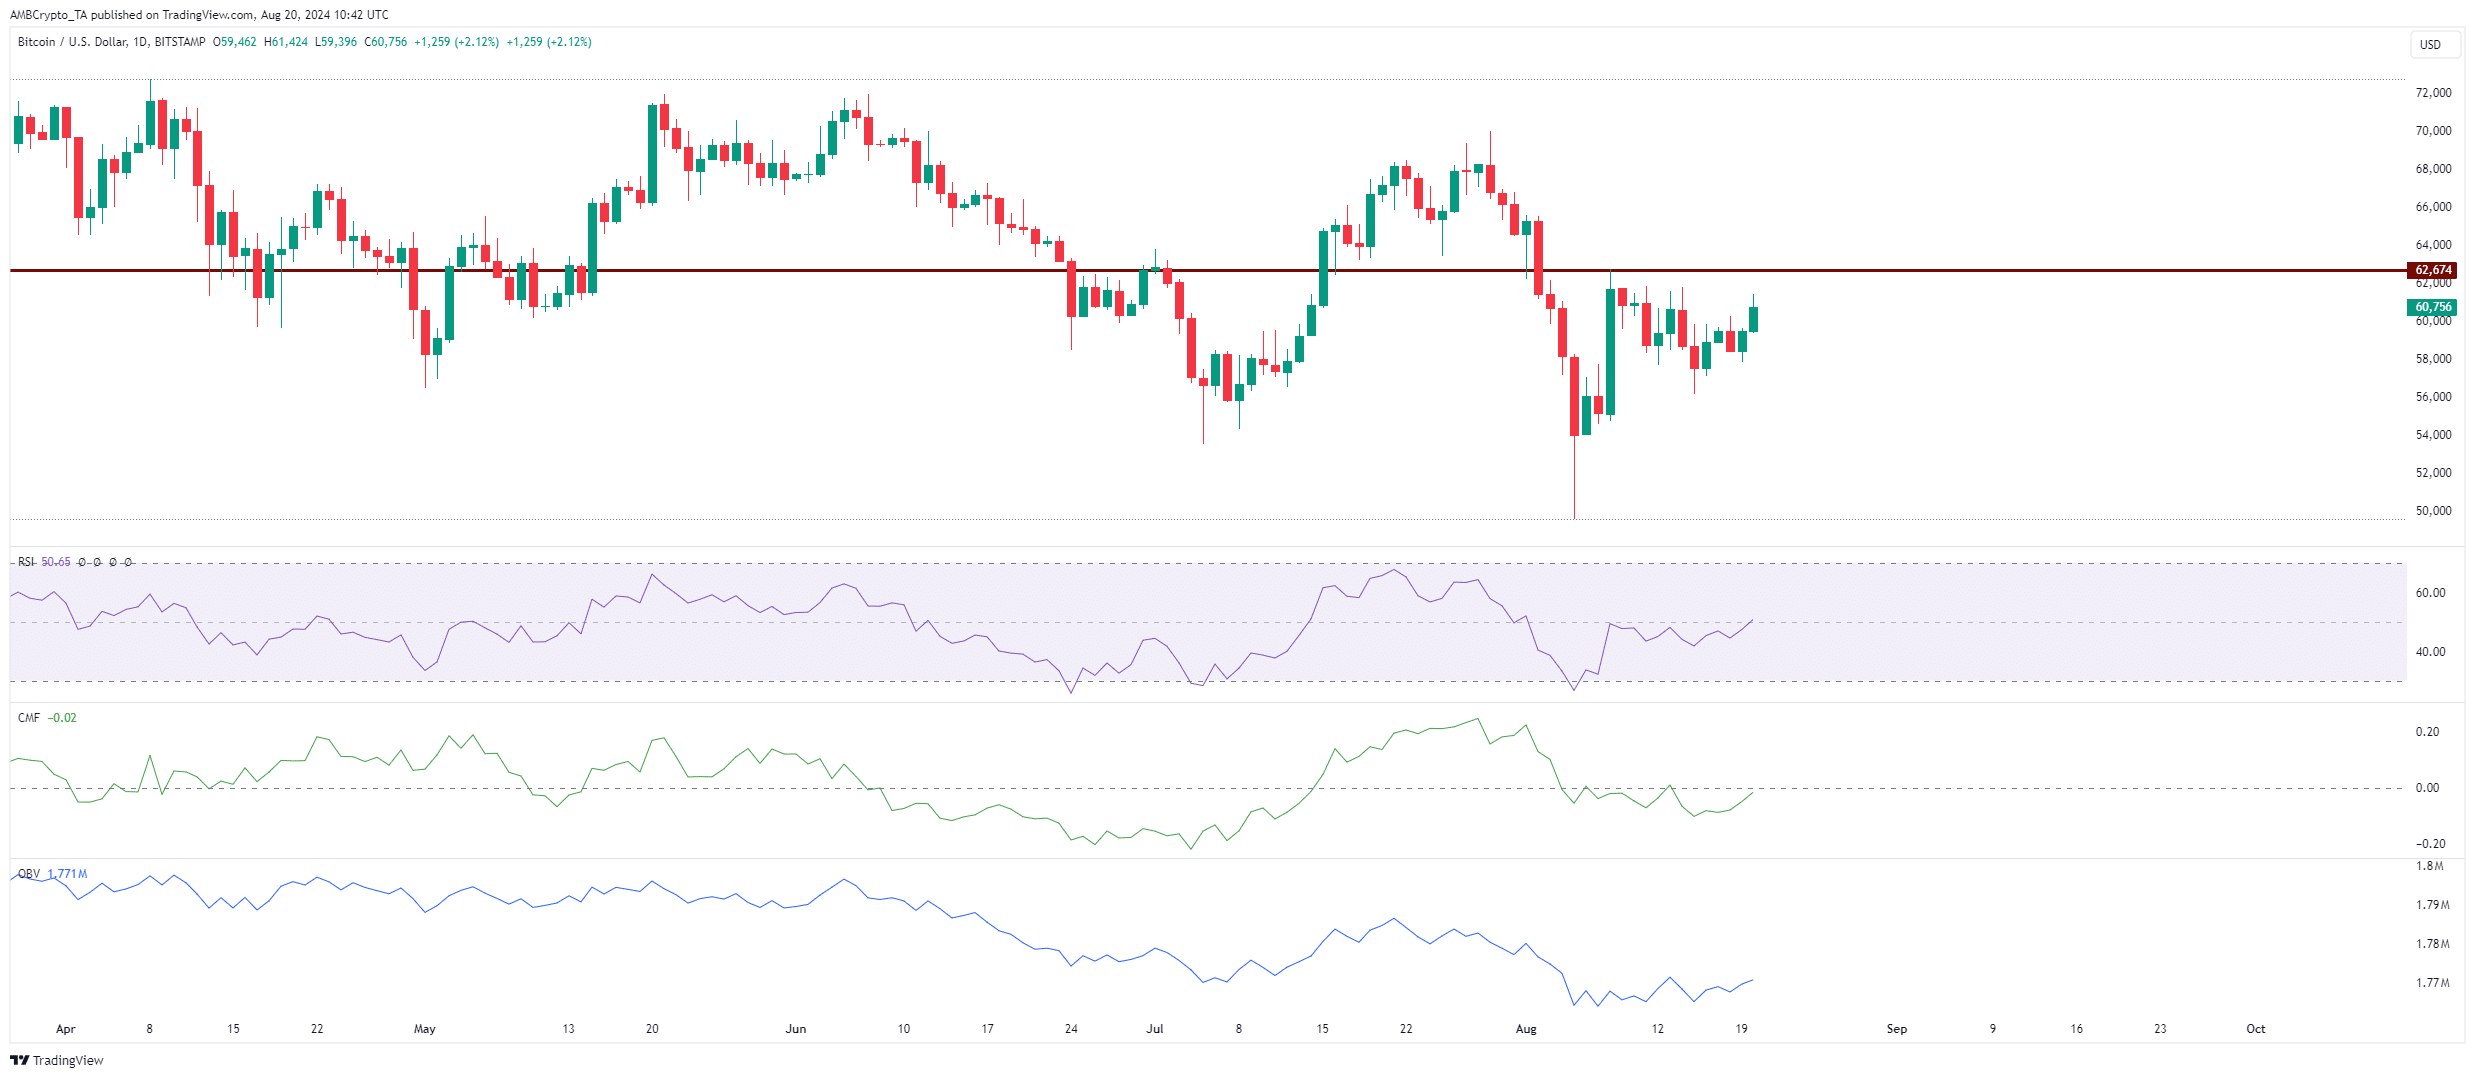
Source : TradingView
Altcoin season might not take hold if USDT dominates
In the same post, Alphractal concluded that the combined dominance of Bitcoin and all stablecoins stood at 65.2%, indicating low interest in altcoins.
Unsurprisingly, Ethereum’s [ETH] price surged beyond $2,600. Following Bitcoin’s rise, it reached $2,651 at press time. Despite this, the altcoin season index remained bearish.
Read Bitcoin’s [BTC] Price Prediction 2024-205
Data from CoinMarketCap revealed a striking trend: while Ethereum’s market cap plummeted by 23.77% and Bitcoin’s by about 9% over the past month, the stablecoin market cap actually grew by 3.04%.
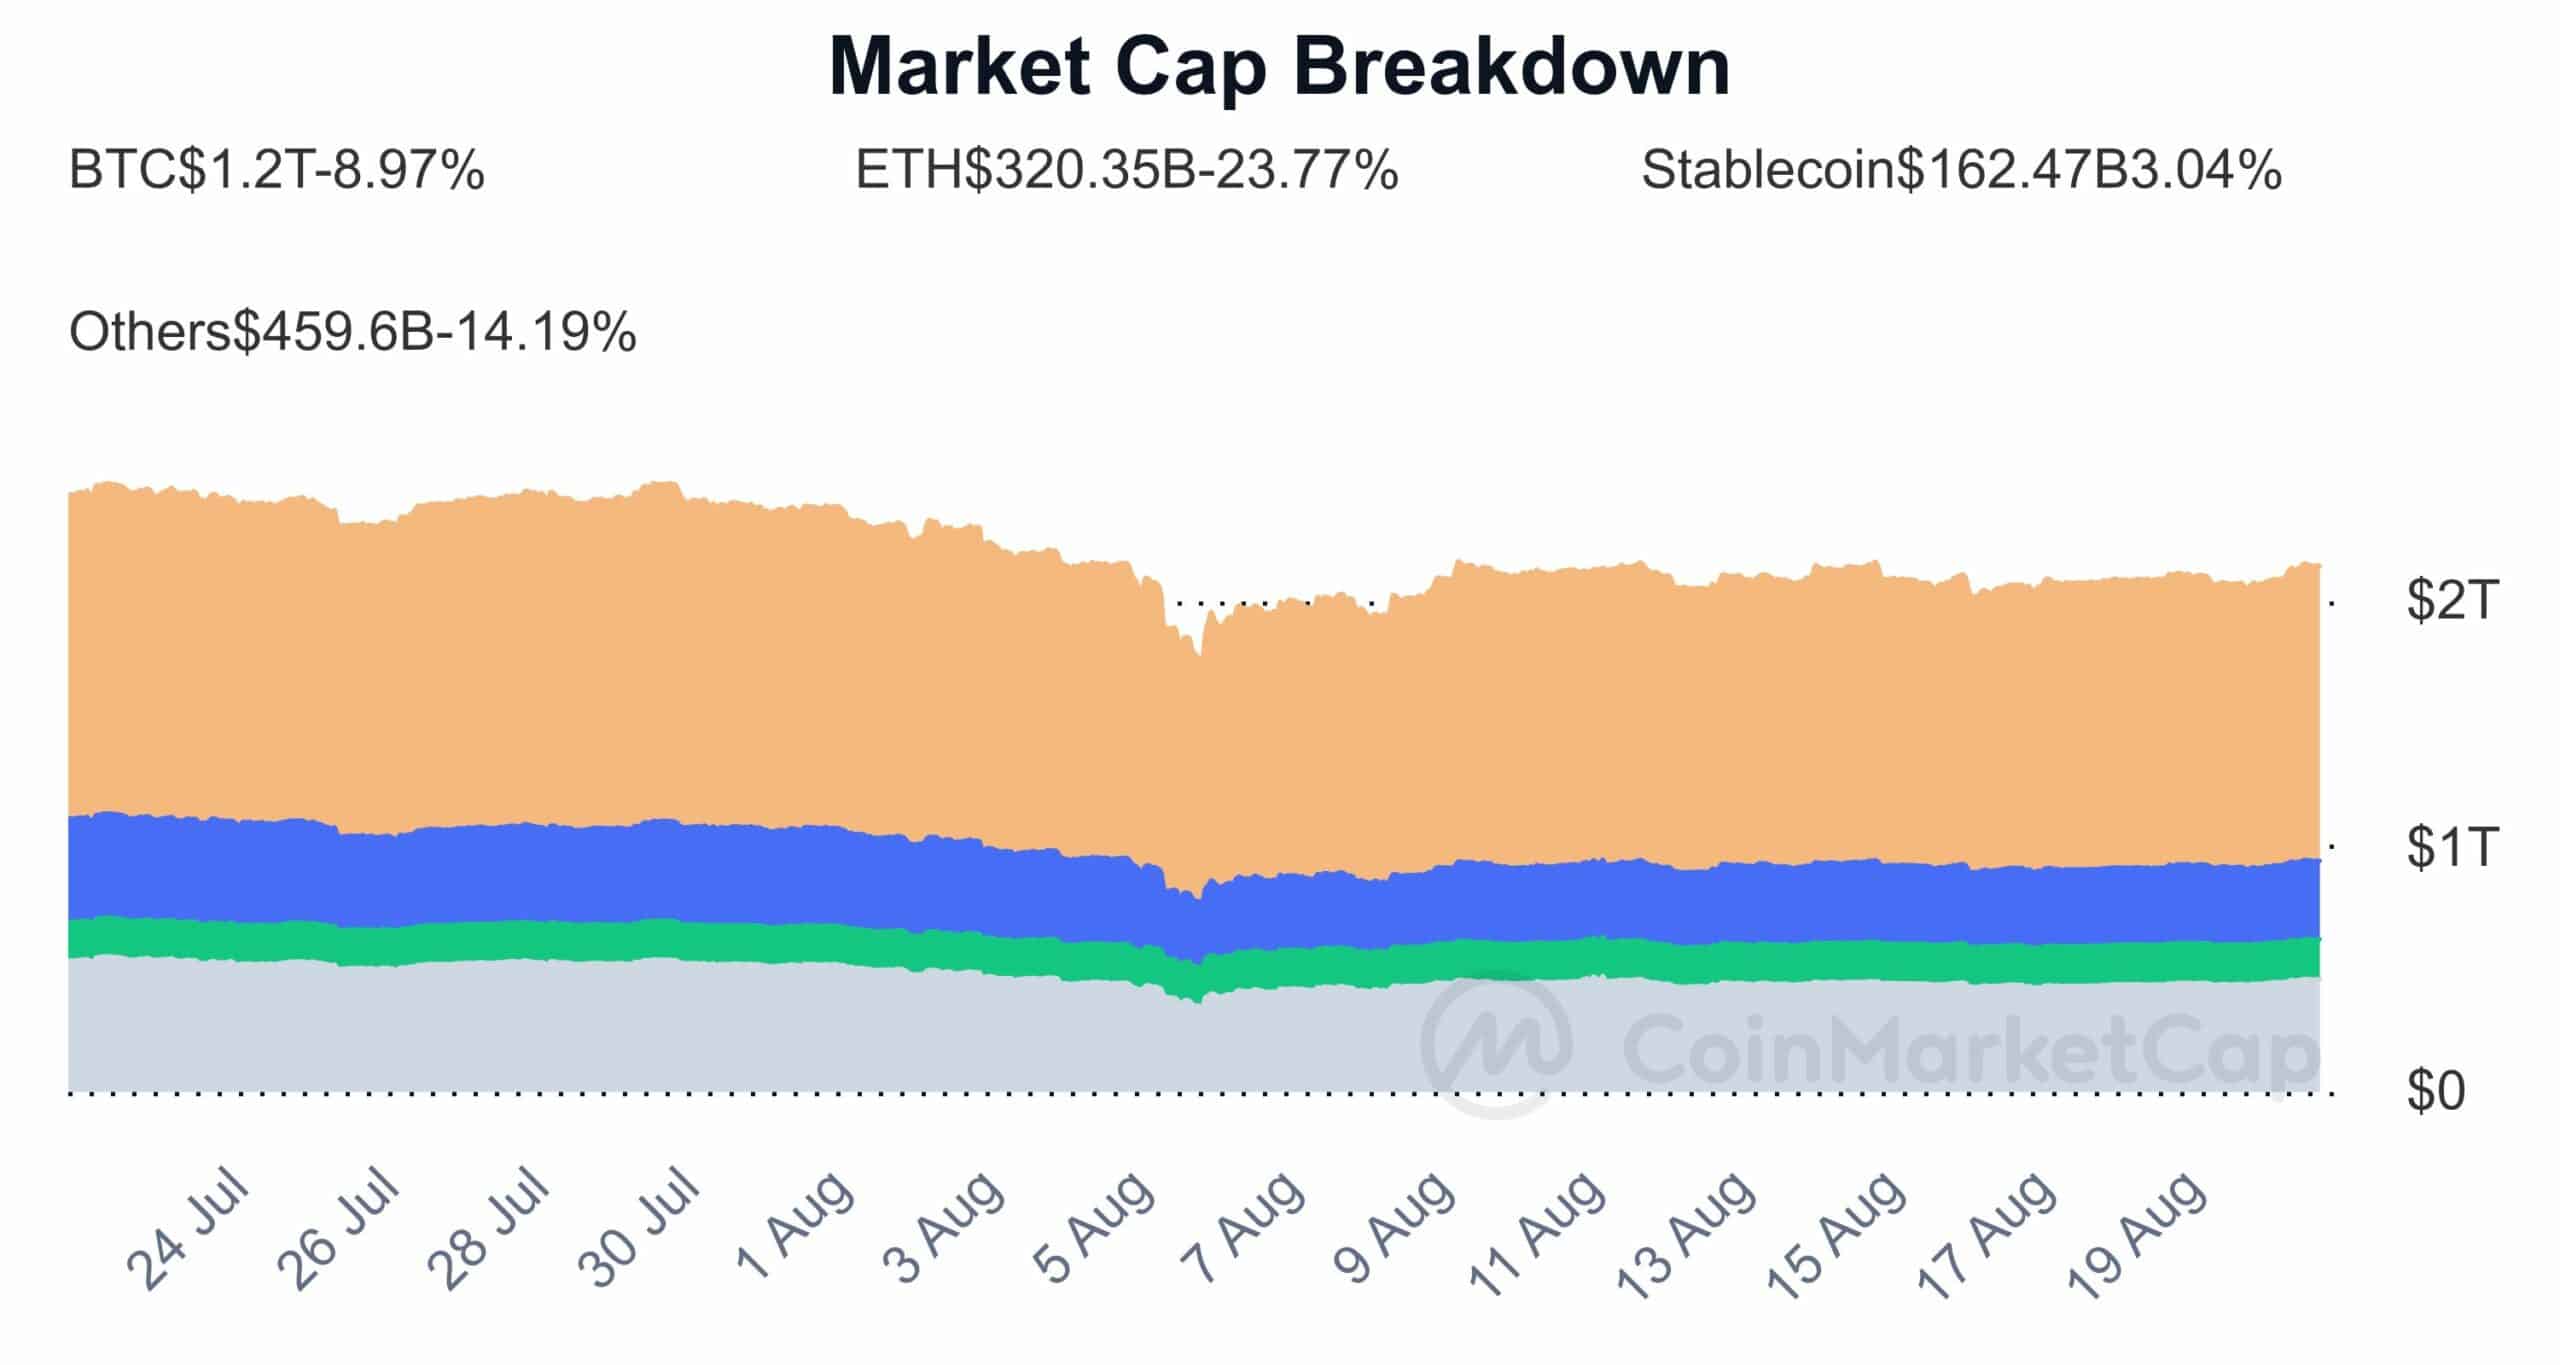
Source : CoinMarketCap
This shift highlighted a rising confidence in stablecoins, which, if unchecked, could dampen the momentum of major cryptocurrencies.

![Bitcoin [BTC]](https://ambcrypto.com/wp-content/uploads/2025/08/Bitcoin-BTC-400x240.webp)


