Will XRP’s price drop to $0.47 after these indicators flash red?
A bearish pattern emerged on XRP’s chart, which might push the token’s price down to $0.47.
- Selling pressure on XRP has increased in the last seven days.
- Most technical indicators suggested that XRP wouldn’t test the bearish pattern.
XRP had an optimistic week as its price increased by over 2%, but volatility dropped. The recent slow-moving price action might just be a prelude for a southward price movement as a bearish pattern emerged on the token’s chart.
XRP’s bearish outlook
CoinMarketCap’s data revealed that the token’s momentum declined as its price only moved marginally in the last 24 hours. At the time of writing, XRP was trading at $0.5297 with a market capitalization of over $29.3 billion, making it the seventh largest crypto.
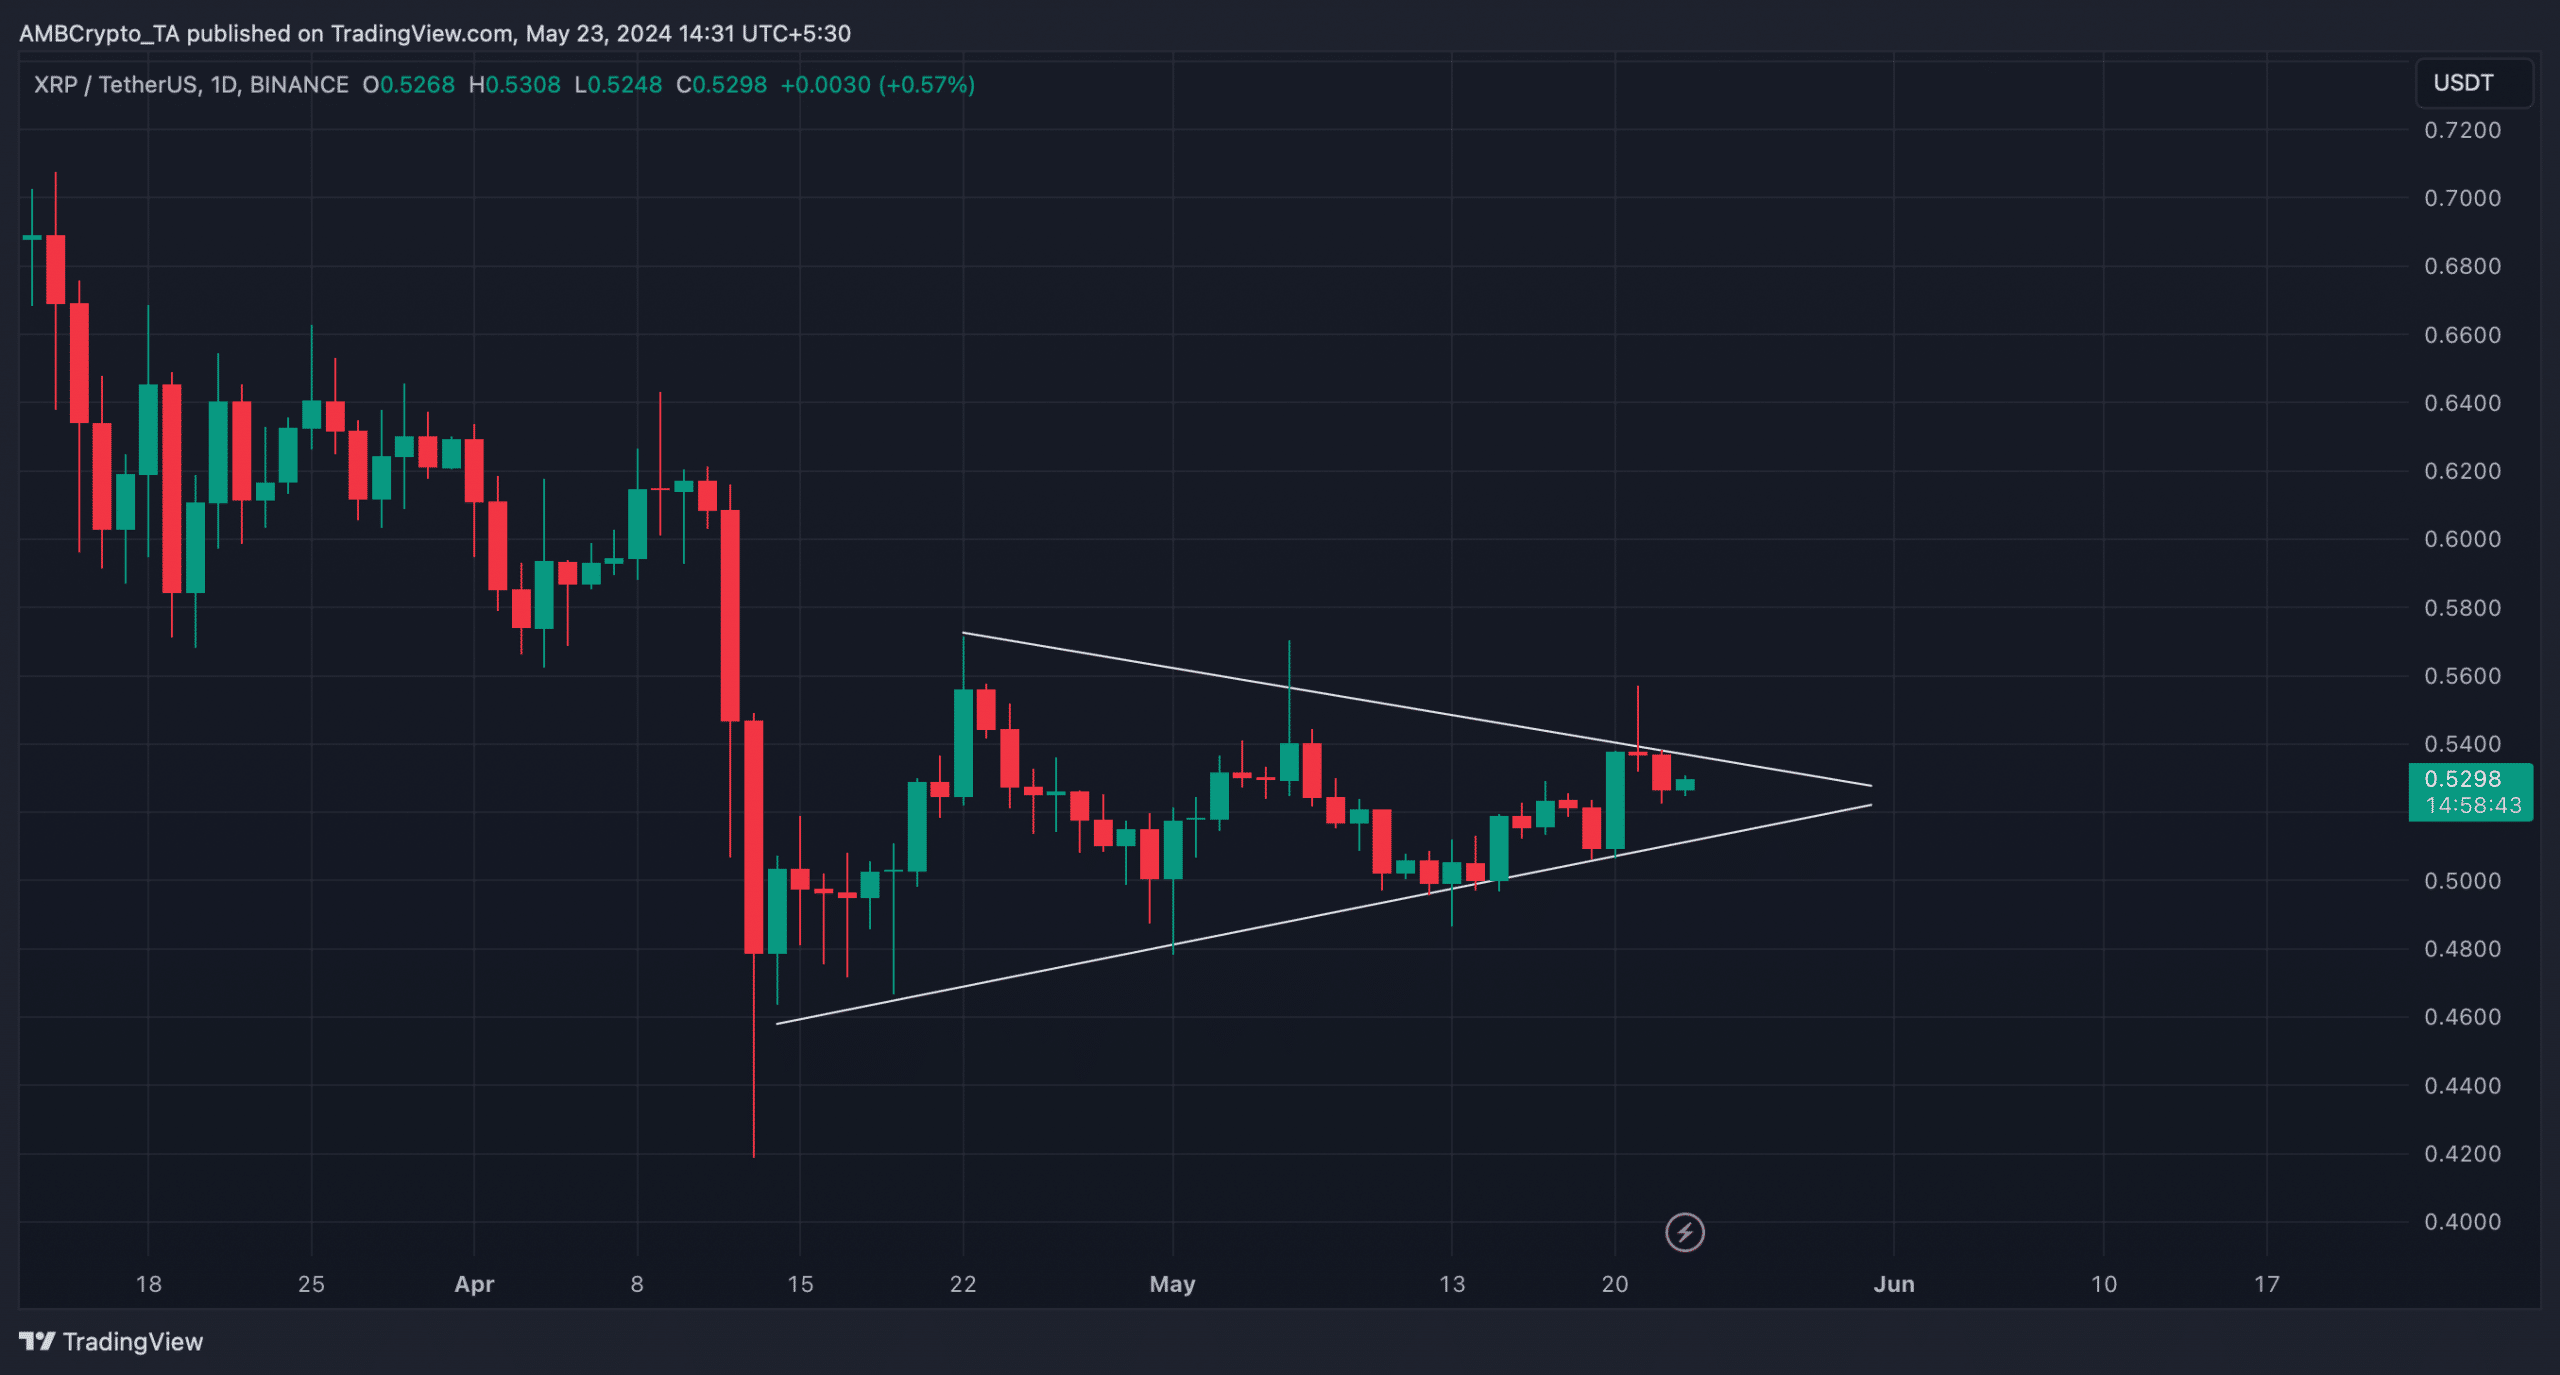
In the meantime, a bearish pattern emerged on the token’s daily chart.
AMBCrypto’s analysis found that a bearish pennant pattern formed in mid-April when XRP witnessed a major price drop. Since then, the token’s price has consolidated inside the pattern.
If XRP tests the pattern, then its price action would soon turn bearish and plummet under the lower trendline, which would result in a further southward price movement.
AMBCrypto then analyzed Santiment’s data to see whether metrics backed the possibility of a price decline.
As per our analysis, XRP’s exchange inflow spiked several times last week. A rise in the metric meant that investors were dumping the token, suggesting high selling pressure.
Its NVT ratio also shot up sharply on the 24th of May, indicating that XRP might be overvalued. Whenever an asset is overvalued, it hints at a price correction.
Another bearish metric was the MVRV ratio, which declined in the last few days.
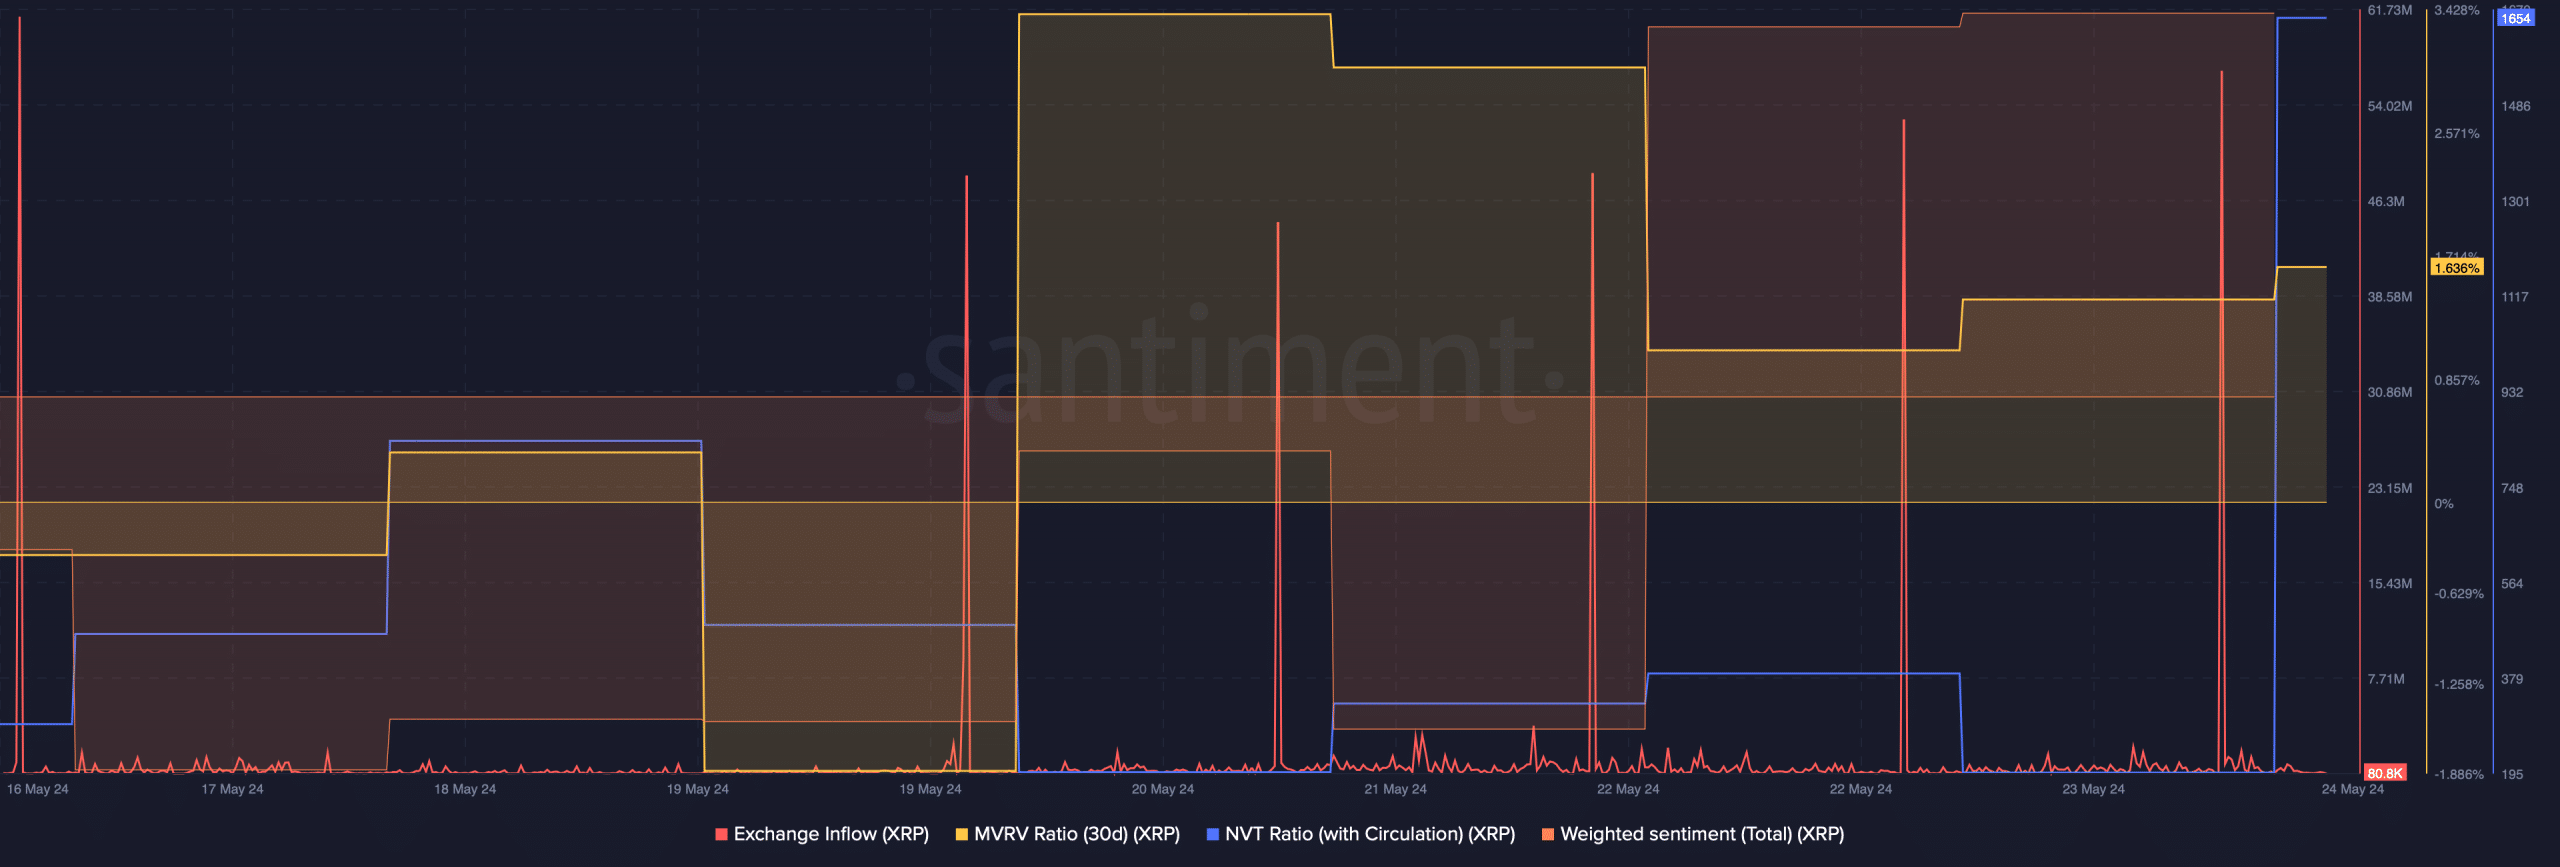
However, a few of the other metrics looked pretty optimistic. For instance, the token’s weighted sentiment increased. This meant that investors were confident in the token, as bullish sentiment around it was dominant in the market.
AMBCrypto’s look at Coinglass’ data revealed that the token’s long/short ratio also increased in the last 12 hours. A high long-short ratio can be inferred as a bullish signal as it suggests a greater desire among investors to buy an asset.

Which way is XRP headed?
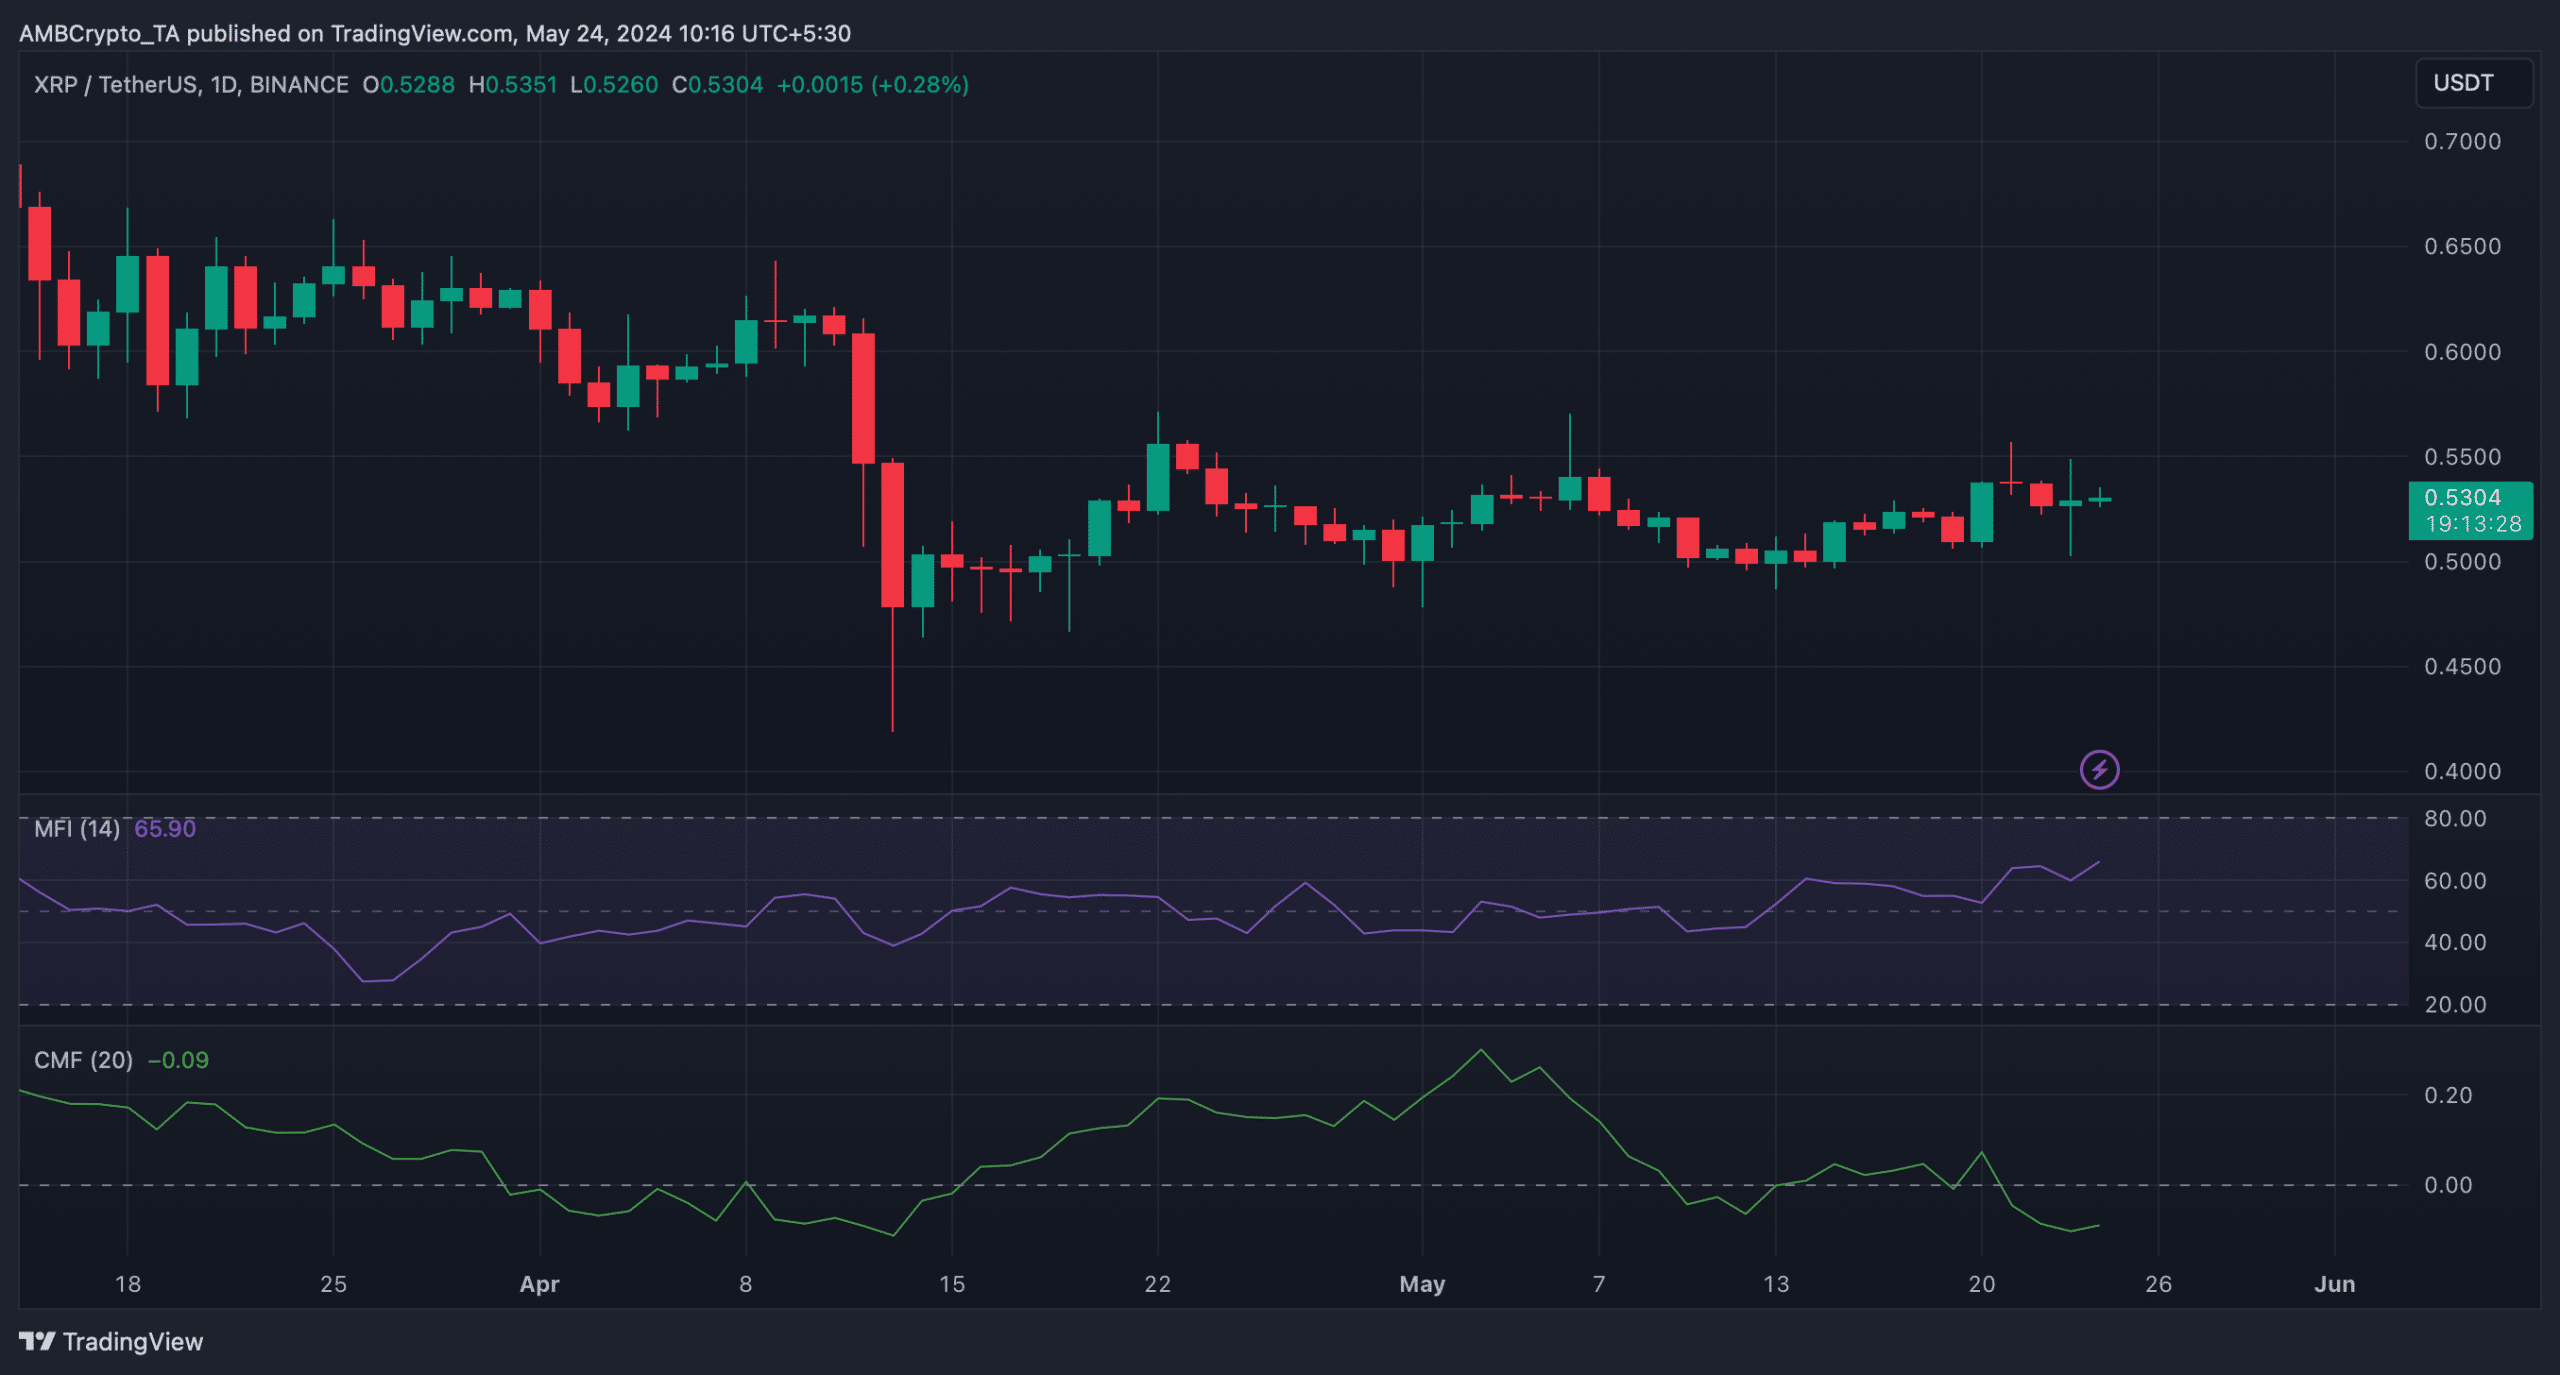
To better understand whether XRP would turn bearish soon, AMBCrypto then took a look at its daily chart. We found that after a dip, XRP’s Chaikin Money Flow (CMF) registered an uptick.
The Money Flow Index (MFI) also went northward, indicating a price rise. If these indicators turn out to be true, then XRP might not test the bearish pennant pattern and continue to remain bullish.
Is your portfolio green? Check out the XRP Profit Calculator
If XRP manages to remain bullish, then its price might reach $0.544 first, as liquidation would rise at that level. Generally, high liquidation results in price corrections.
On the other hand, if XRP tests the bearish pattern, then its price might plummet to $0.47 in the coming days.


