With Bitcoin playing safe close to $50,000, is it going to be a bull trap or a bull run

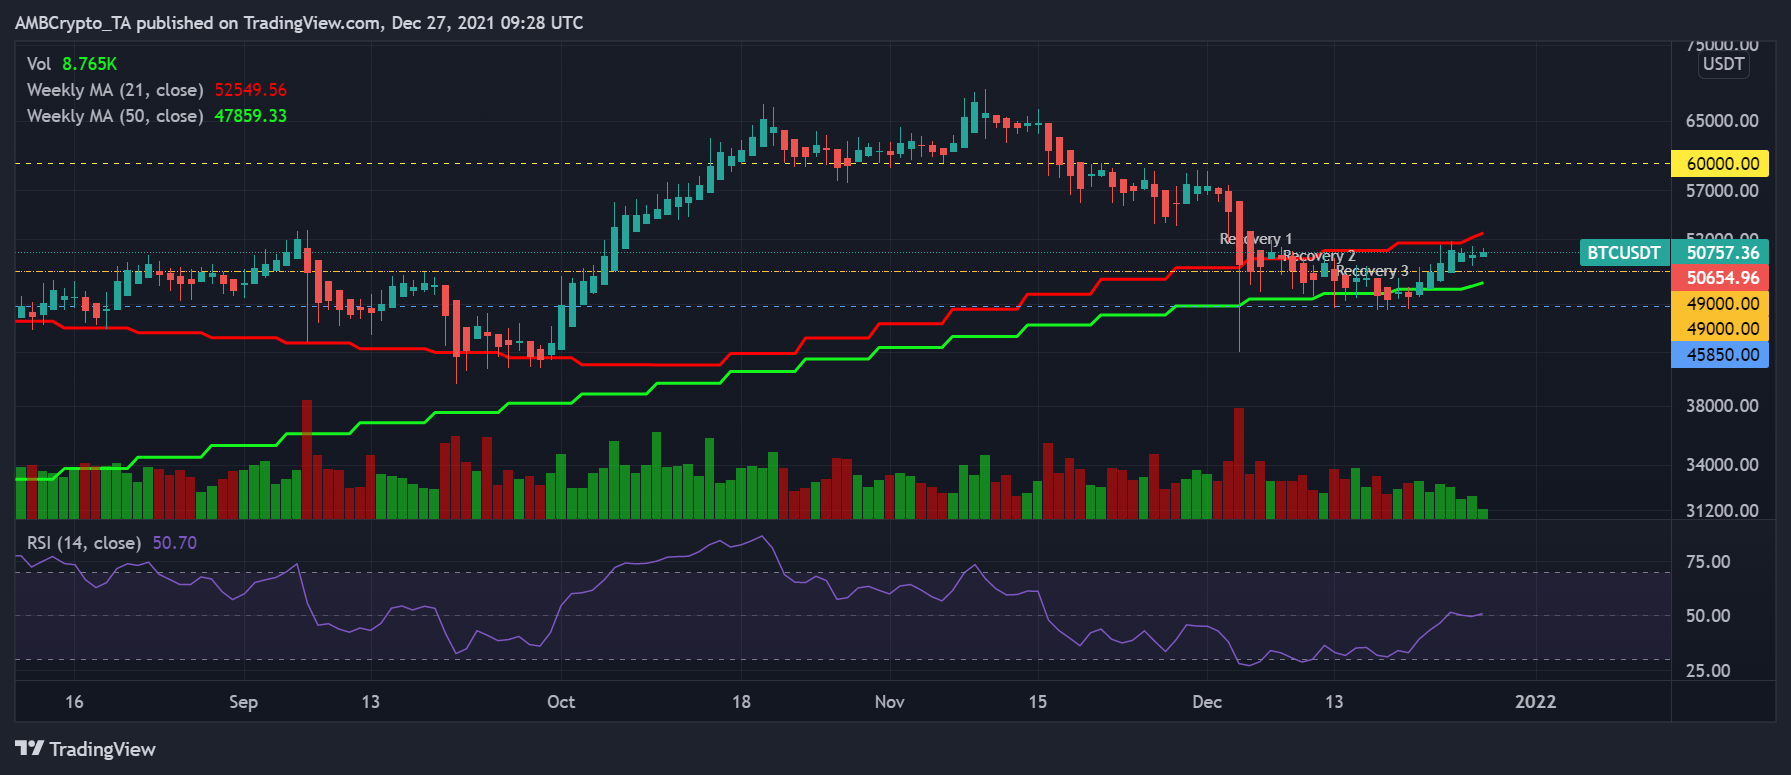
Bitcoin has been playing it safe, close to the $50K mark for the last five days as the larger market’s trajectory looked largely bullish, as the new year approaches. After three short-term recoveries, BTC’s trajectory finally managed to make higher highs with the price safely above the $50K mark.
Nonetheless, with low retail euphoria and overheated futures market whether the recent trajectory is in fact a bull run or a mere bull trap before the year closes, is still a matter of debate.
Summing up BTC’s run above $50K
Bitcoin’s price seemed to be approaching its upper limit after the recent rally from $45K to $51K over the last four days. On December 24, BTC was retesting the 21 Week Moving Average (WMA) after a bounce from the 50 WMA on 21 December.
The resistance level above $53,350 will be the first hurdle BTC will face if it manages to pull through the 21 WMA. However for the rally to sustain, BTC would need to make higher highs or higher lows for the coming three days.
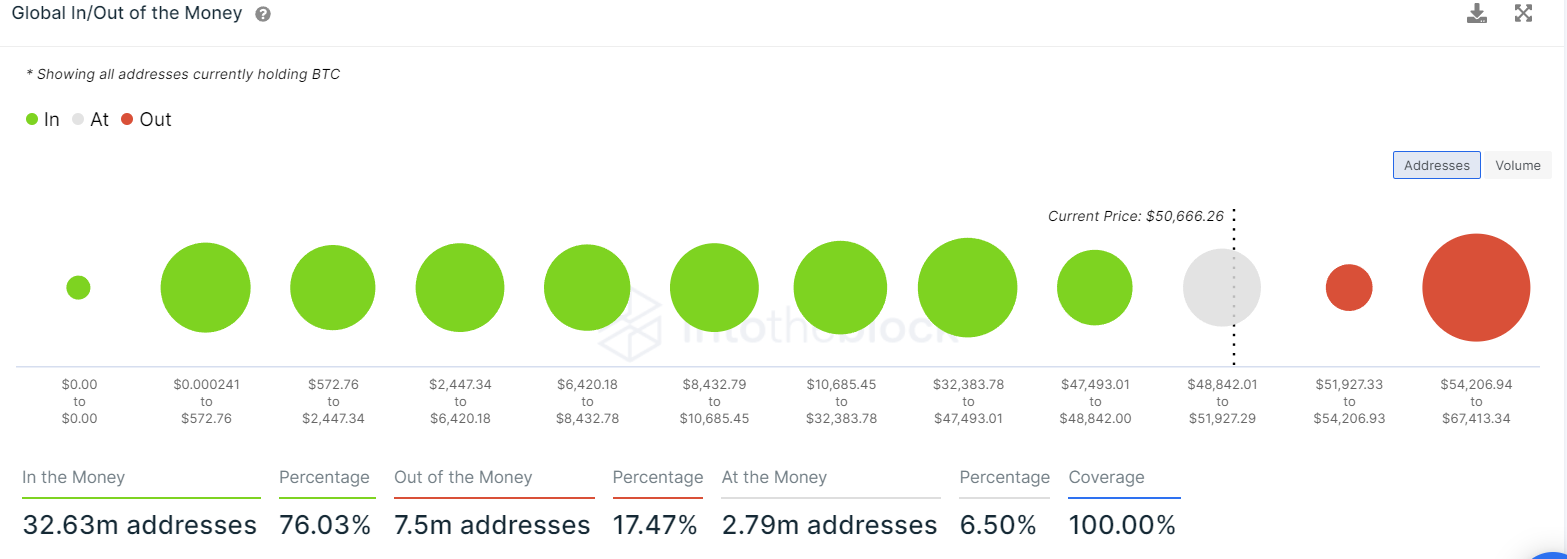
In and out of money for Bitcoin presents that around 513k addresses that purchased nearly 382k BTC at an average price of $53,203 are still in a loss or ‘Out of the Money.’ If the top asset overcomes this price range and produces a daily close above the $53,200 level a majority of these HODLers will enter the safe zone, which could reduce sell-side pressure
So, what’s the problem?
With BTC’s price still around $50K, the bullish and bearish sides are equally prevalent at the moment. However, the upper resistances are relatively weaker, while the support zone is stronger which paves the way for the asset’s run if BTC bulls can push for higher gains.
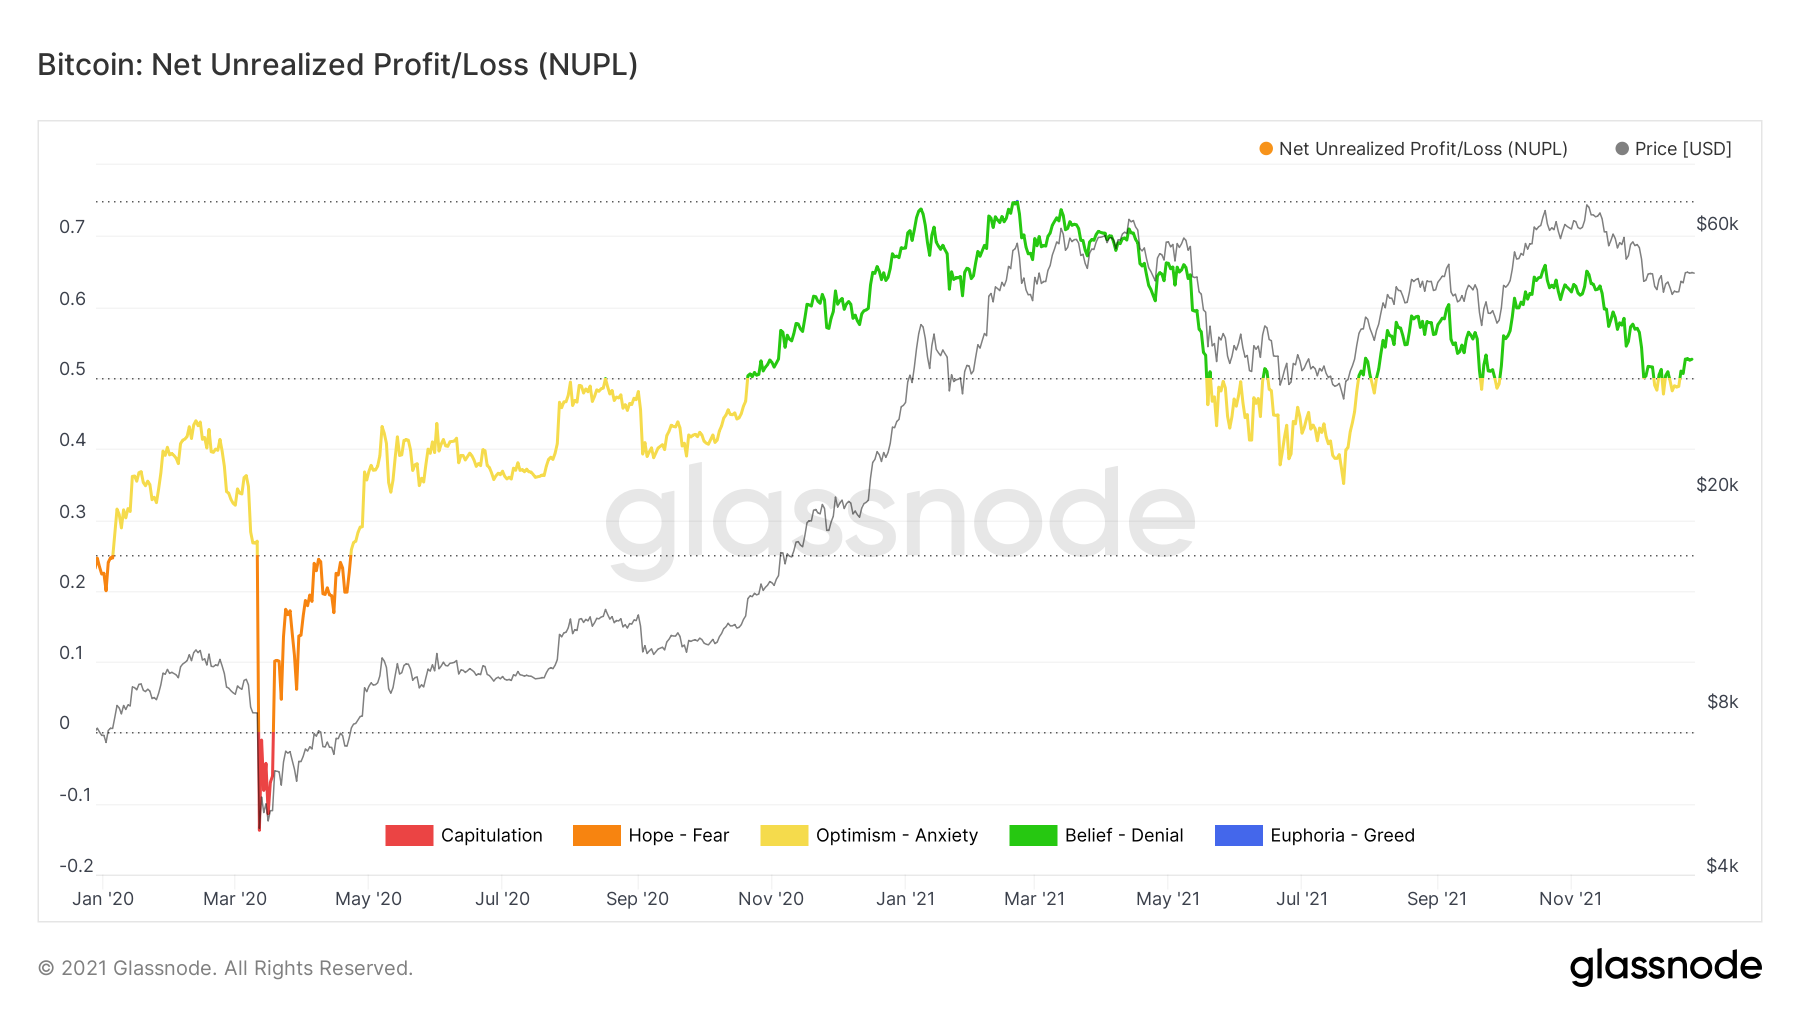
The Net Unrealized Profit/Loss (NUPL) for BTC turned positive on 20 December, highlighting that the network is in a state of net profit. Usually, recovery of the NUPL signal to the green zone of belief-denial has been an effective indicator of the beginning of a rally.
That being said, the 365-day and 30-day Market Value to Realized Value (MVRV) are both below zero which meant that another flash crash of a huge magnitude is unlikely in the mid-short term.
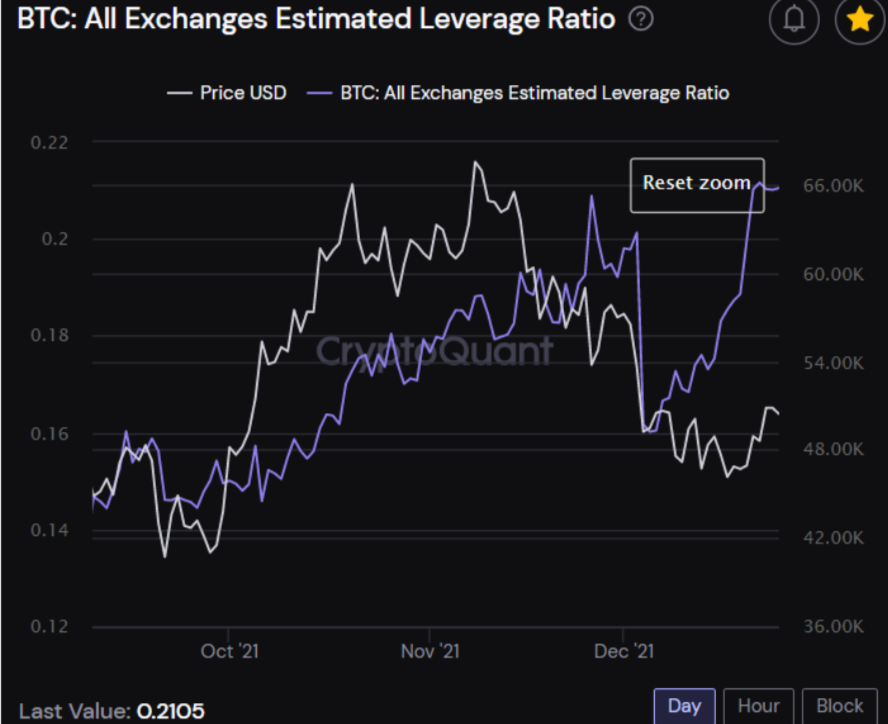
However, with retail traders getting wiped out, the leverage ratio hit an all-time high recently. In fact, large Binance deposits occurred which could form a ‘potential bull trap’ even though the larger trend shows accumulation.
Further, with the futures market looking overheated with open interest, leverage ratio noting gains and retail investors’ sentiment still being neutral, the market’s scales could tip on either side.
Looking at the current state of leverage ratio, a June 2021 like price pullback could be expected, however the same can be averted if the price maintains its bullish trajectory for the coming few days as the market enters a new year.


