


- Litecoin’s supporter says LTC may continue to follow Bitcoin’s trend into the bull cycle.
- HODLers have stopped cashing out and accumulation has taken over.
Bitcoin’s [BTC] impressive run in the last few weeks has kept its “lighter version” Litecoin [LTC] on the sidelines. Despite not getting the same audience as the king coin, LTC has had a relatively good last 30 days, as its price increased to $66.38.
Realistic or not, here’s LTC’s market cap in BTC’s terms
A rise for BTC is a rise for LTC
Meanwhile, the price increase is not the only notable development that has occurred within the Litecoin network. According to Crypto-Keys.com founder and Litecoin supporter Shan Belew, Litecoin’s fair network value has been rising since 22 October.
Litecoin's fair network value today keeps rising. It is now at $1249 – $3178.
This range will rise as Bitcoin rises into the full bull market. It sounds crazy but 30k isn't out of the question this cycle. $LTCUSD pic.twitter.com/w8kI6kNzWg
— mstr (@MASTERBTCLTC) October 21, 2023
The metric is defined as the value that the cryptocurrency could reach if Bitcoin begins rising in a full-blown bull cycle. Belew’s prediction was that LTC’s value could hit between $1,249 and $3,178 probably after the 2024 Bitcoin halving.
On an all-time basis, LTC’s performance was nowhere near BTC. However, in the last three months, the correlation coefficient between Bitcoin and Litecoin was 0.78.
The correlation between historical prices or returns on Litecoin and Bitcoin is a relative statistical measure of the degree to which these cryptocurrencies tend to move together.
Values of the correlation coefficient usually range from -1 to +1. Typically, the correlation of zero (0) is possible when the price movement of Litecoin has no effect on the direction of Bitcoin. Conversely, a correlation of one (1) implies a perfect directional movement.
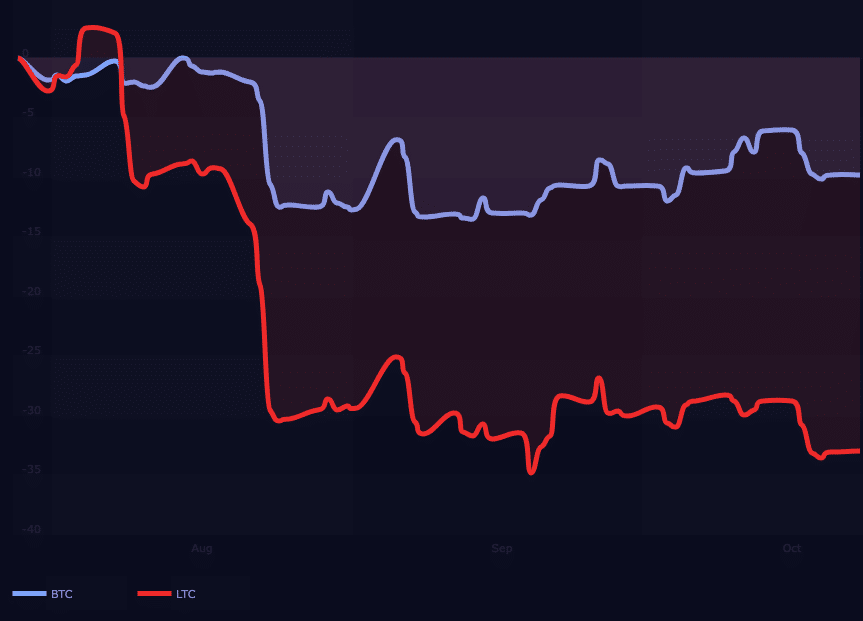
At 0.78, the coefficient implies that Litecoin, most times, follows the direction of Bitcoin. Hence, if BTC’s value were to increase exponentially, then LTC would most likely accompany it.
Considering LTC’s price action, the four-hour chart against the USD showed that there has been some profit-taking after the coin’s monumental rise began on 19 October.
Long-term bets on the light coin
For instance, there was resistance at $64.99. Later, after buyers tried to push the price upwards, sellers decided to send LTC back to $64.01. With the current technical outlook, LTC’s price may continue to increase over the coming days.
This was because the 20-day Exponential Moving Average (EMA), in blue, has made a crossover above the 50 EMA (yellow). This is usually a buy/long sign. So, traders may want to remain bullish on the coin.
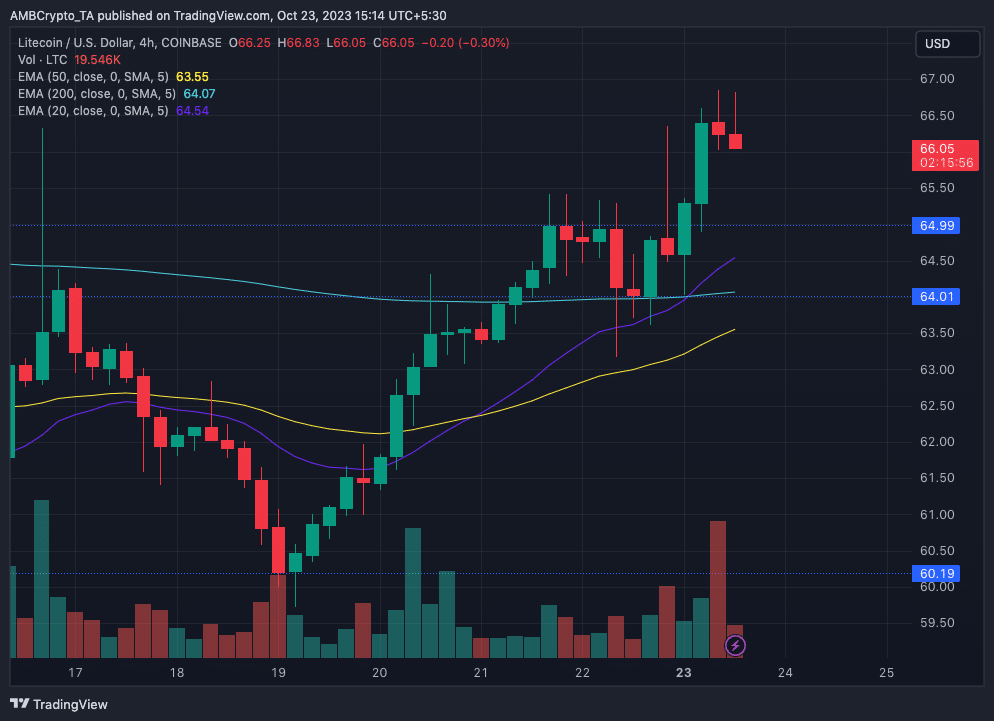
If any decline occurs, Litecoin is likely to recover as the 200 EMA (cyan) was above both the 50 and 20 EMAs. Besides, the technical indicator, on-chain data also supports LTC’s uptick to continue for the main time.

Read Litecoin’s [LTC] Price Prediction 2023-2024
This conclusion was derived from Litecoin’s Hodler net position change, coined from Glassnode. The Hodler net position change shows the monthly position change of long-term investors. When the metric is negative, it means HODLers are cashing out.
However, the metric was 400,994 at press time. This means that new positions are being accumulated. Thereby giving LTC the strength to resist any major selling pressure.