With Dogecoin stuck in a consolidation range, here’s what to expect going forward
Disclaimer: The findings of the following analysis are the sole opinions of the writer and should not be considered investment advice
Bitcoin’s volatility appeared to have a negative effect on Dogecoin and its price action. Bitcoin has a bullish near-term bias after it broke above $41.5k, but Dogecoin remained stuck within a range on the price charts. Resistance remained strong above Dogecoin, notably at the $0.15 area.
DOGE- 2 Hour Chart
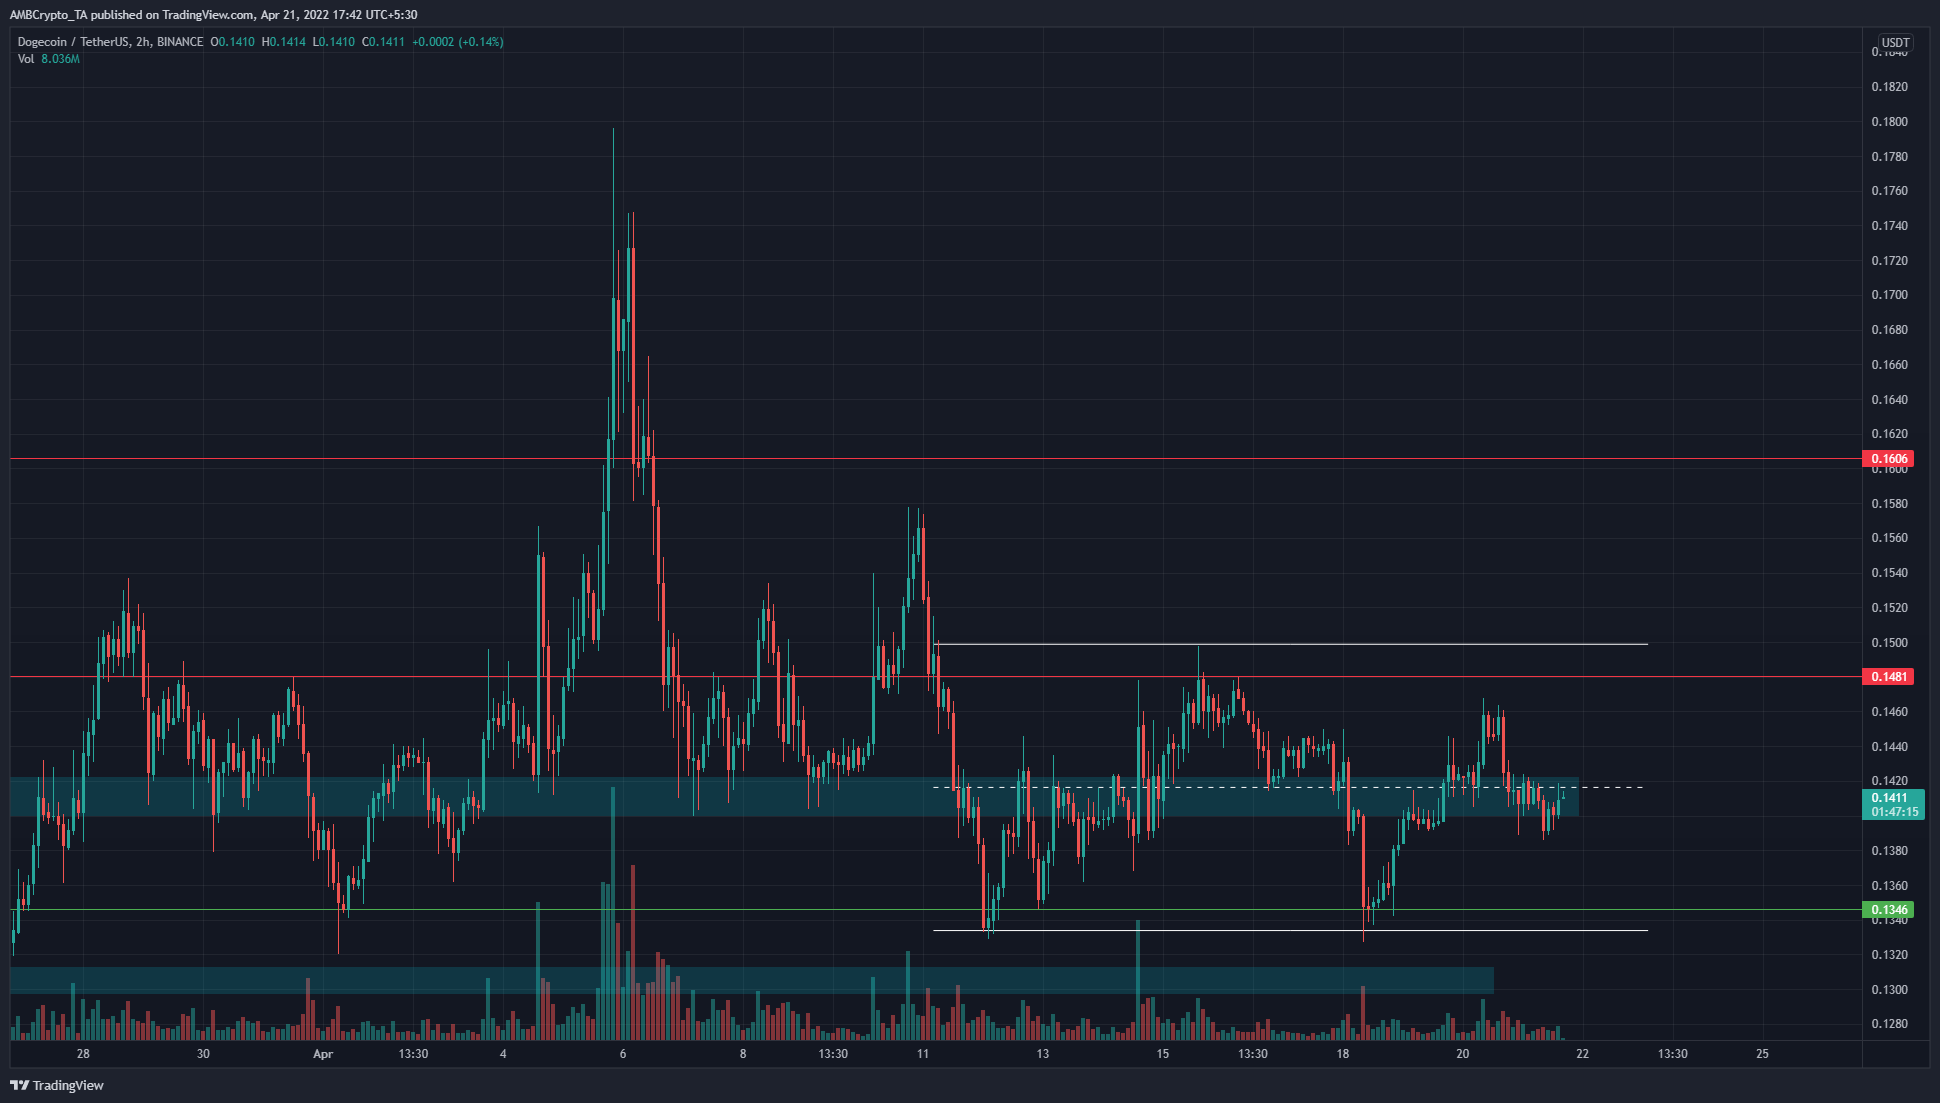
The $0.14-$0.142 area (cyan box) has acted as both a demand and supply zone for DOGE in the past few weeks. In the past week, DOGE appeared to form a range between $0.133-$0.15, with the mid-range point (dotted white) at $0.141.
Alongside the range lows, the horizontal $0.134 level has also seen demand arrive for DOGE. The market structure had a bearish bias to it for the month of April. The strong surge to $0.17 has nor been followed up by higher lows and higher highs.
Instead, the $0.14 area was contested by bears and bulls, and the $0.148 resistance has also held strong in recent days.
Rationale
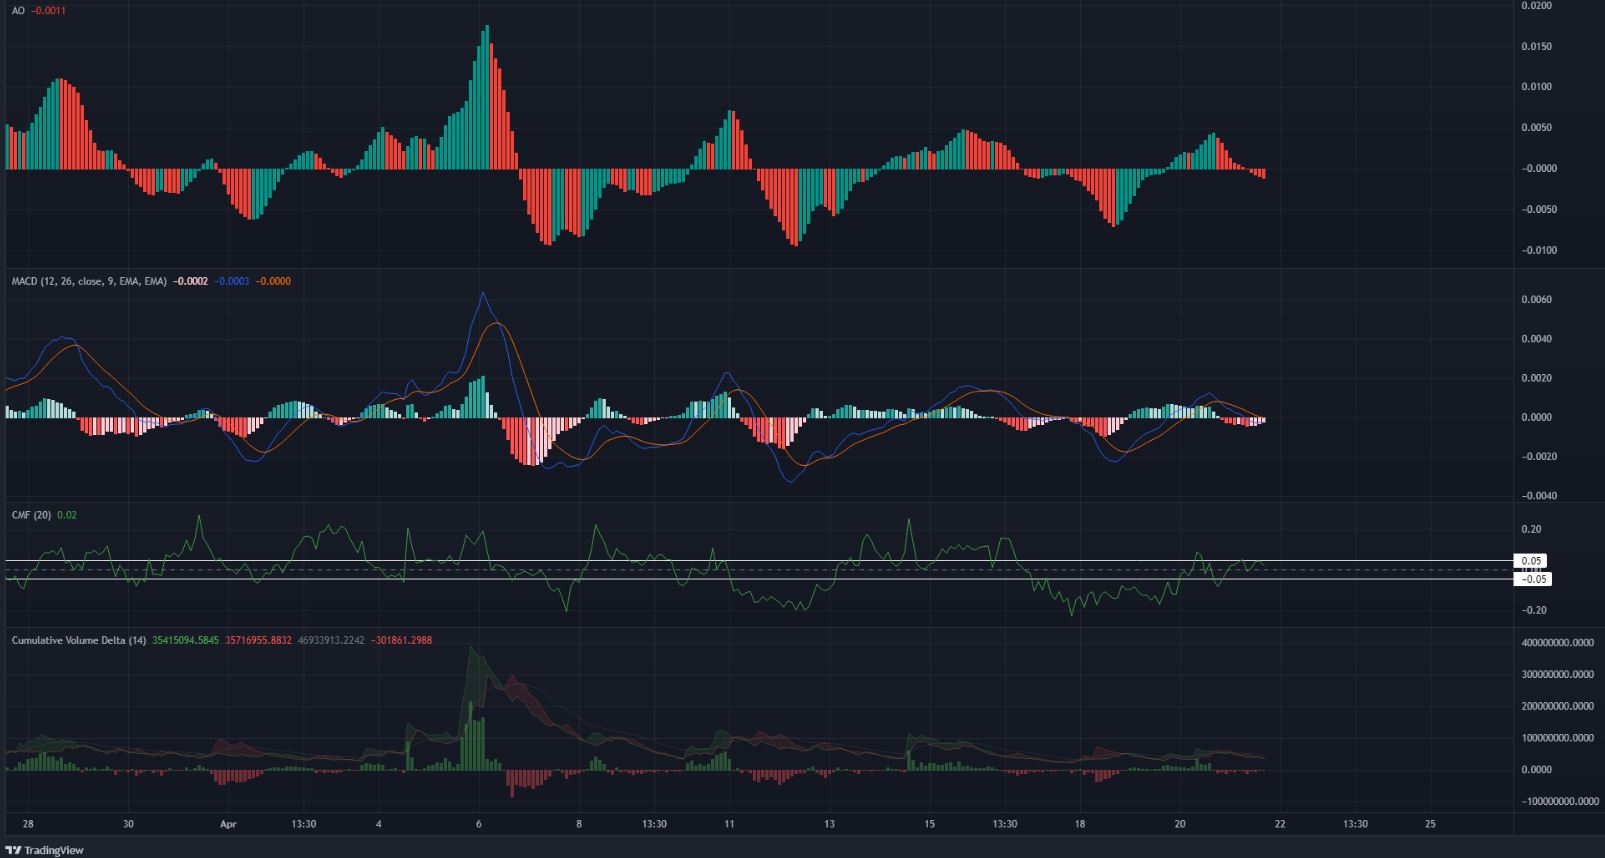
The Awesome Oscillator dipped beneath the zero line, while the MACD also formed a bearish crossover even as it appeared to descend beneath the zero line. A divergence wasn’t yet spotted. Alongside the fact that DOGE has slipped beneath the mid-range point, it appeared that further bearish momentum could arise.
The Chaikin Money Flow and the Cumulative Volume Delta indicators were neutral and slightly bearish respectively. The CMF was within the -0.05 to +0.05 area to suggest that capital flow did not favor either bears or bulls at the time of writing. The CVD showed sellers to have the upper hand, but only barely.
Conclusion
The mid-range area highlighted on the chart could have been flipped into a zone of demand, and the mid-point of the range to resistance. The indicators showed that bearish momentum appeared to be on the verge of picking up strength.
This could see DOGE drop toward the range lows before demand steps in.