Worldcoin prices fall 20%: Should you hold on or let go?
Worldcoin investors need to exercise patience, as the fall below $7 was an early sign of a higher timeframe trend change.

- Worldcoin was undervalued but investors need not bid right away.
- The development activity was encouraging but the short-term bias was in favor of the sellers.
Worldcoin [WLD] has a bullish market structure but also strong bearish sentiment in the short term. To resolve this contradiction, AMBCrypto took a look at on-chain metrics as well as the futures market data.
With Bitcoin [BTC] struggling to recover, more volatility can not be ruled out. Hence, risk management should be of vital importance to investors, whose aim should be to identify higher timeframe demand zones.
The development activity was strong in March
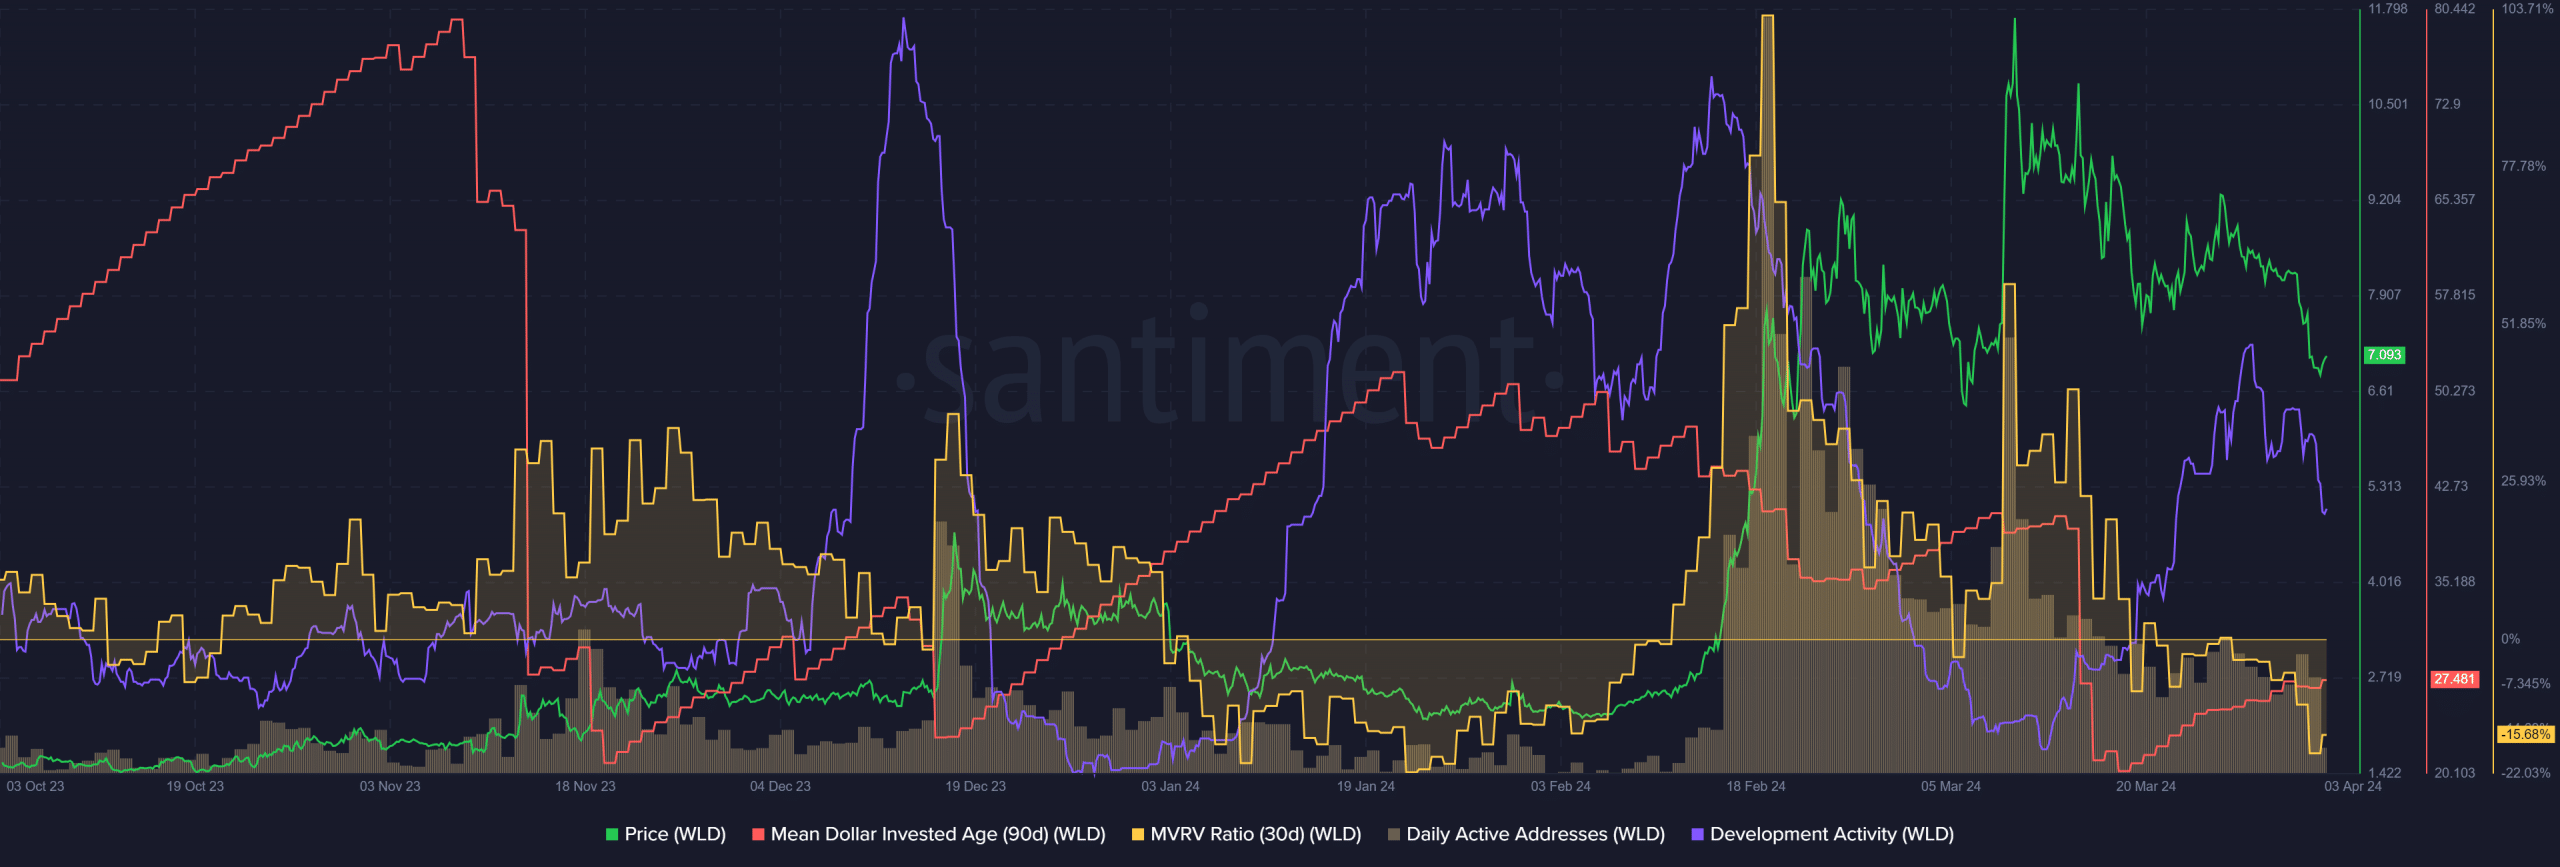
The development activity had taken a downturn since mid-February, but this was reversed after the 16th of March. During that time, the Mean Dollar Invested Age (MDIA) also began to tick faintly upward.
The MDIA had been in a downtrend since the latter half of January as prices trended upward manifold. This signaled bullishness and old coins re-entering circulation. The uptick suggested a consolidation phase could be underway.
The 30-day MVRV ratio was negative, reaching lows not seen since the 22nd of January. This meant the asset was undervalued. But WLD buyers should consider other factors before looking to go shopping during this dip.
Assessing the market sentiment
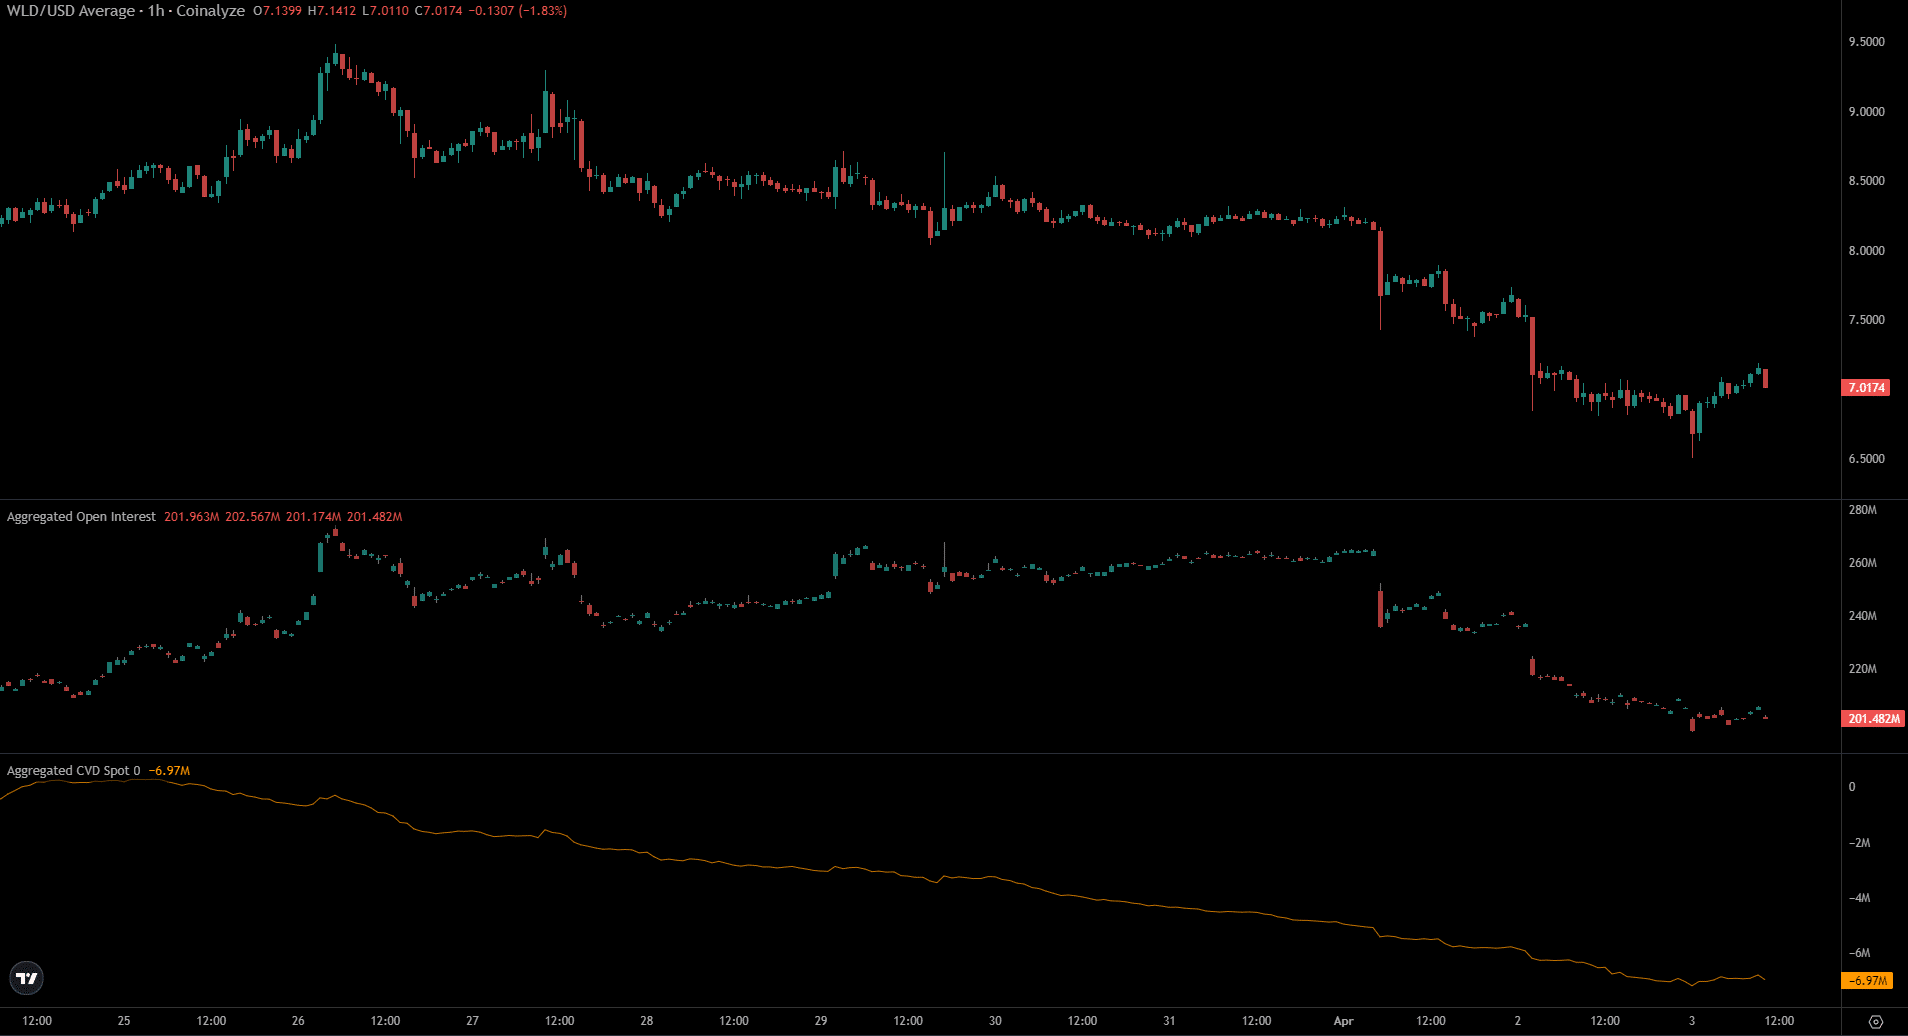
Since the 1st of April both the Open Interest and Worldcoin prices have fallen lower. This showed bearish sentiment, but not a spree of short-selling. Speculators preferred to remain sidelined.
The spot CVD was also in a strong downtrend for more than a week. It reflected steady selling pressure in the spot market. Until it began to reverse, it remained likely that WLD would be headed further south.
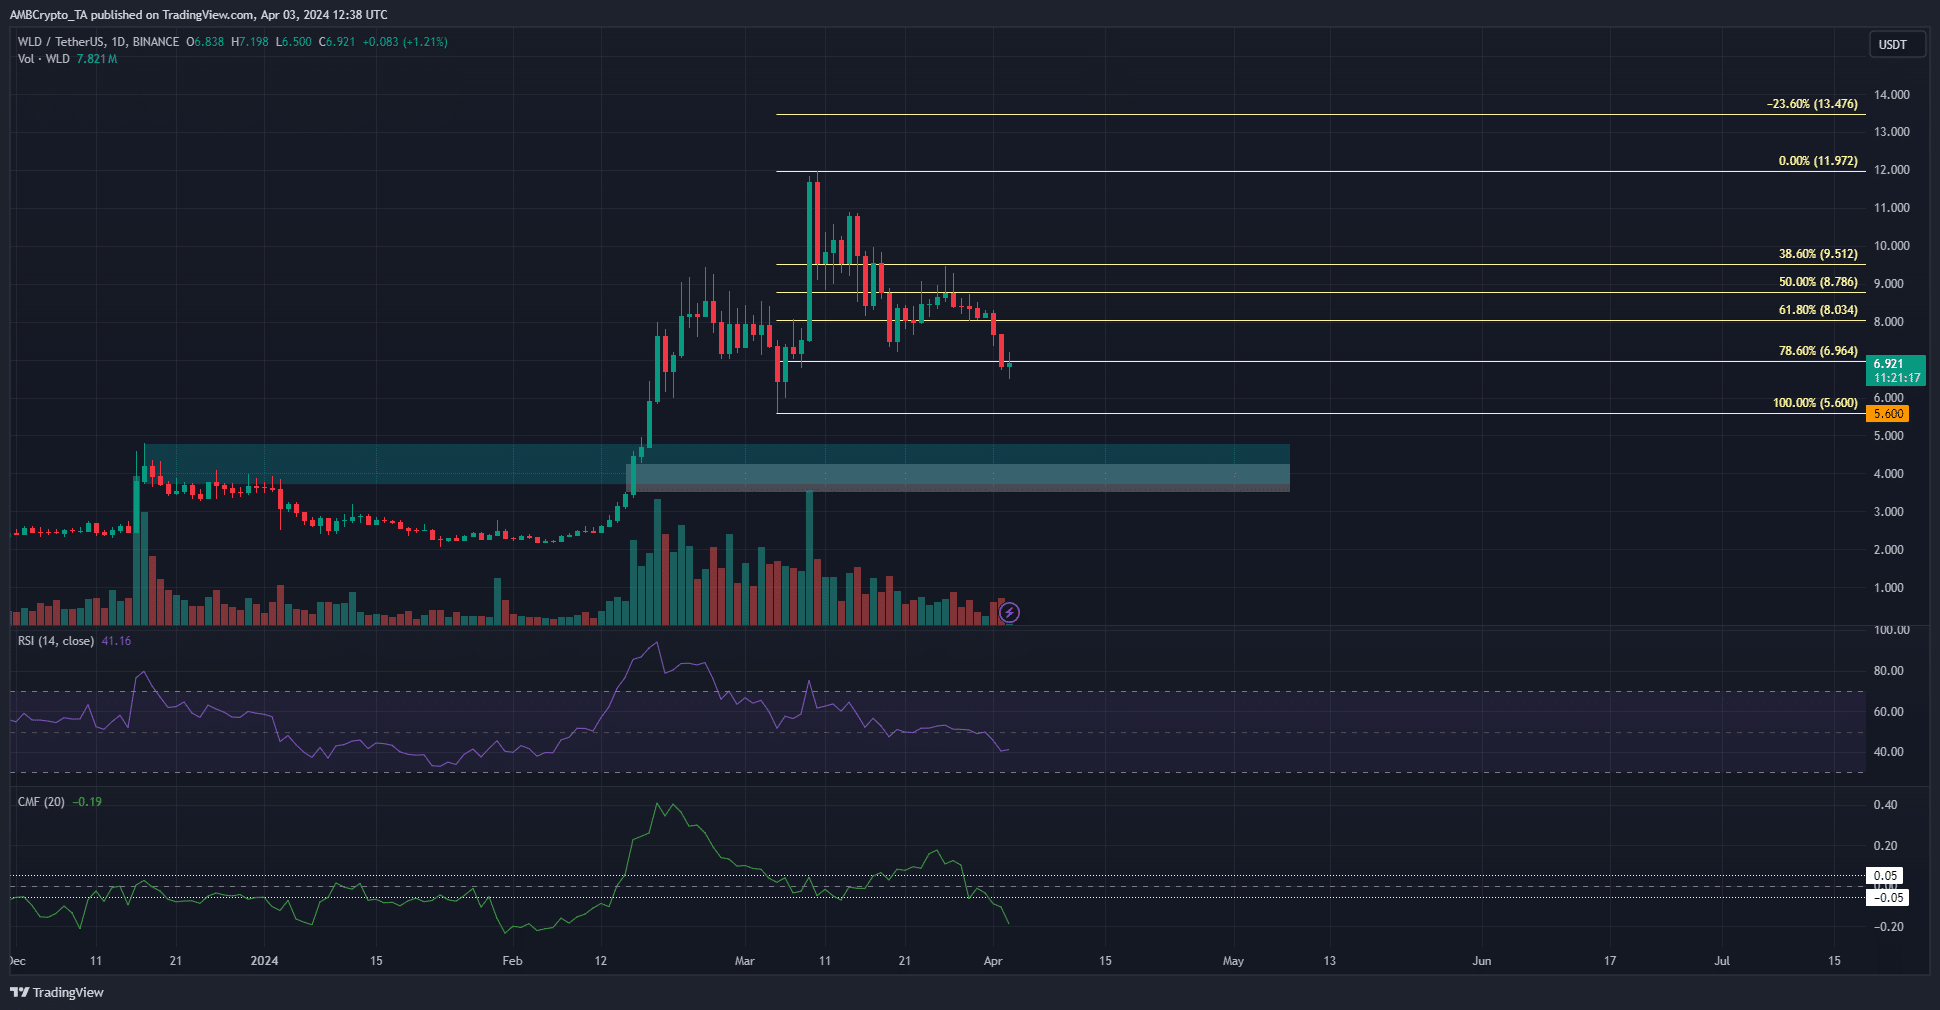
Technical analysis showed that the $4 region was an HTF support zone that should see a bullish reaction. Yet, if prices do get there, the market structure would already be bearish on the daily timeframe.
The 78.6% Fibonacci retracement level has been breached. If a daily session closes below $5.6, swing traders could flip their bias bearishly.
Read Worldcoin’s [WLD] Price Prediction 2024-25
The RSI had hugged neutral 50 over the past ten days but fell swiftly in the past three days. The Chaikin Money Flow also dived beneath the -0.05 mark.
Together they indicated strong bearish momentum and significant capital flow out of the Worldcoin markets.