Worldcoin up 31% in 6 days, flips $2.5 to support: Is $4.5 next?
Traders should be wary of a breakout beyond $4 since the market might be overextended.

- Worldcoin had a strong short-term bullish expectation.
- The bearish divergence could be followed by a price dip toward $3.3.
Worldcoin [WLD] has managed to flip the $2.5 resistance zone to support and targeted the $4.5 level next. The daily and weekly market structures were both bullish, although there was a bearish divergence for WLD.
This could see a price dip in the coming days. The $3.26 level has been flipped to support as well, and a deeper retracement appeared unlikely due to the strong capital inflows.
Moving average crossover captures Worldcoin bullishness
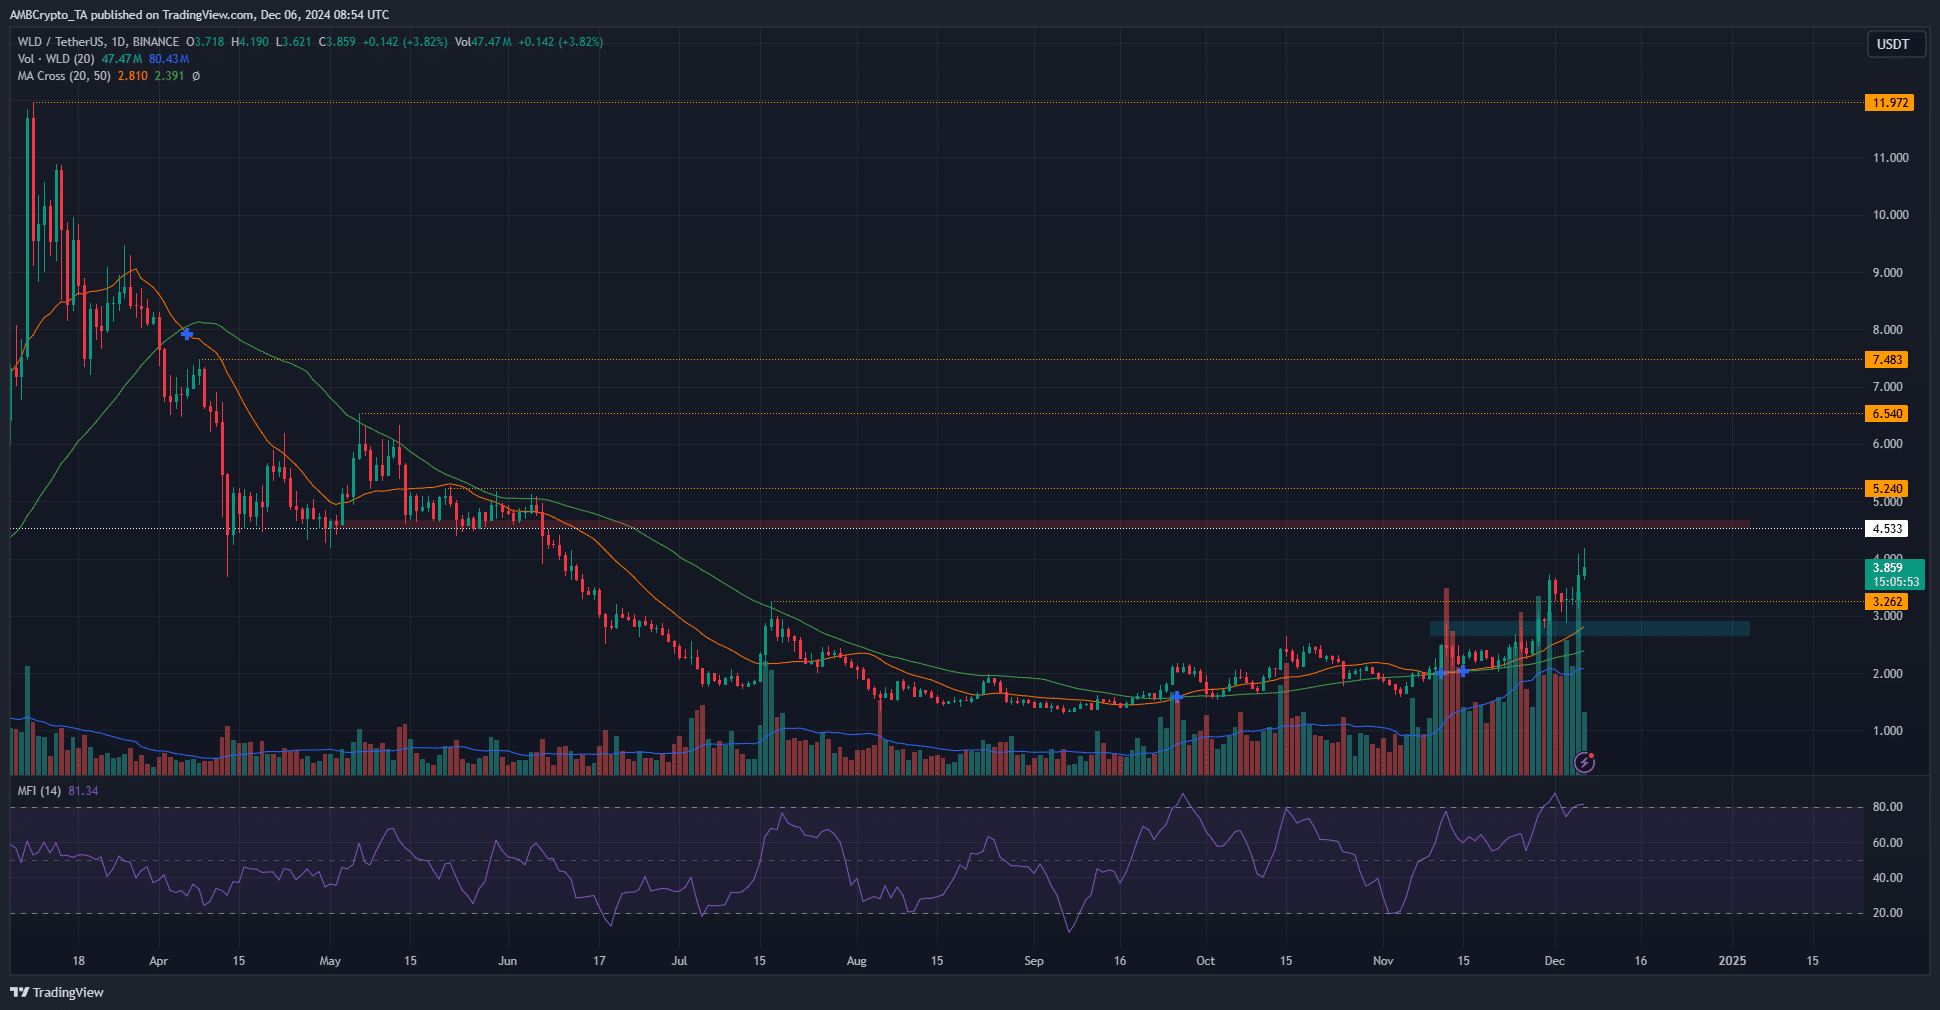
On the daily chart, WLD experienced a sharp downtrend from March to September, followed by a month of consolidation. Since the September lows, WLD has surged 198% as of press time. A significant portion of these gains occurred in the past ten days after the $2.5 resistance zone was breached.
The $2.5-$2.9 zone has since been retested as a demand zone. Buyers successfully defended it, pushing Worldcoin past the $3.26 resistance, which was a lower high from July.
The weekly market structure turned bullish following the breach of $3.26. The daily structure has been bullish since the second week of November after a late October pullback dropped the price to $1.589.
The 20 and 50-day moving averages have formed a bullish crossover, likely serving as support in the event of a retest. The Money Flow Index (MFI) is at 81 and could form a bearish divergence, making a lower high compared to December 1st.
The next target for the bulls is the $4.5 region, which had been a key support from April to June. Therefore, a rally beyond this level could take time to materialize, with consolidation beneath the resistance expected.
Short-term sentiment remains firmly bullish
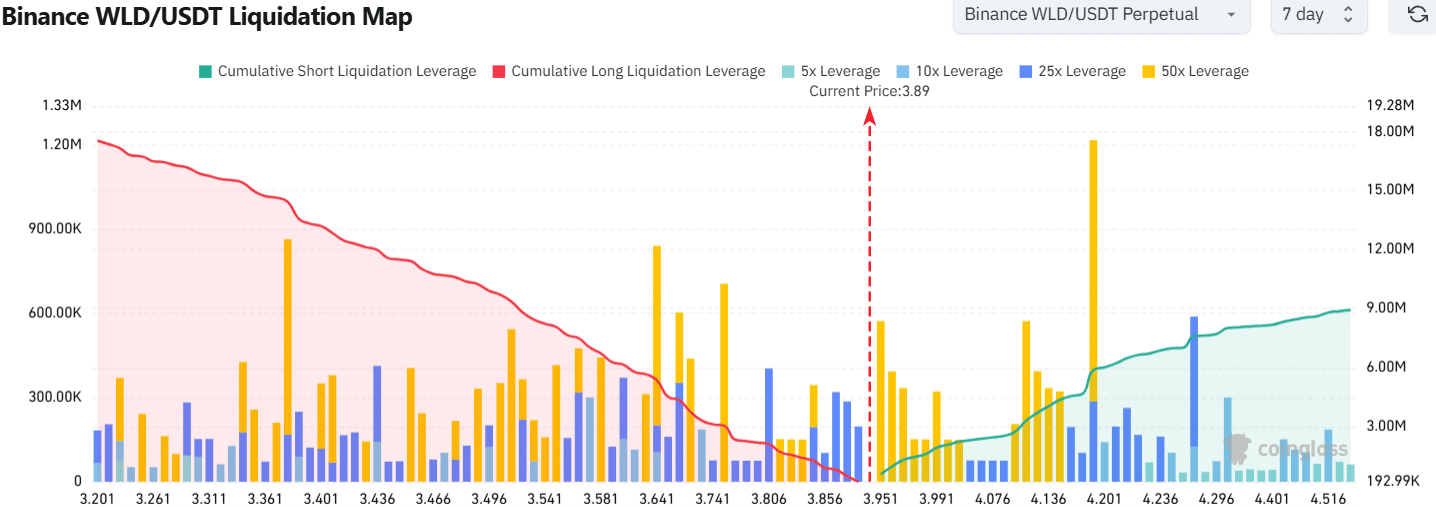
While the bearish divergence warned of a pullback, the liquidation map showed a push northward is likely. There was a large amount of short liquidations piled up around $4 and $4.15.
Realistic or not, here’s WLD’s market cap in BTC’s terms
The high cumulative leverage around the $4.13 mark meant that it was likely that WLD would move higher to sweep this region before a retreat. At press time, it is unclear if the buyers have the strength to push prices beyond $4.
Traders should be wary of a breakout beyond $4 since the market might be overextended.
Disclaimer: The information presented does not constitute financial, investment, trading, or other types of advice and is solely the writer’s opinion


