Analysis
XEN crypto surges 75% within a day: Key levels to watch
The high trading volume and the bullish belief across the market impelled XEN crypto prices higher- and further gains were likely.

- XEN crypto holders and traders must approach the market in vastly different ways.
- Key levels overhead were visible for traders, but holders must strap in for a longer ride.
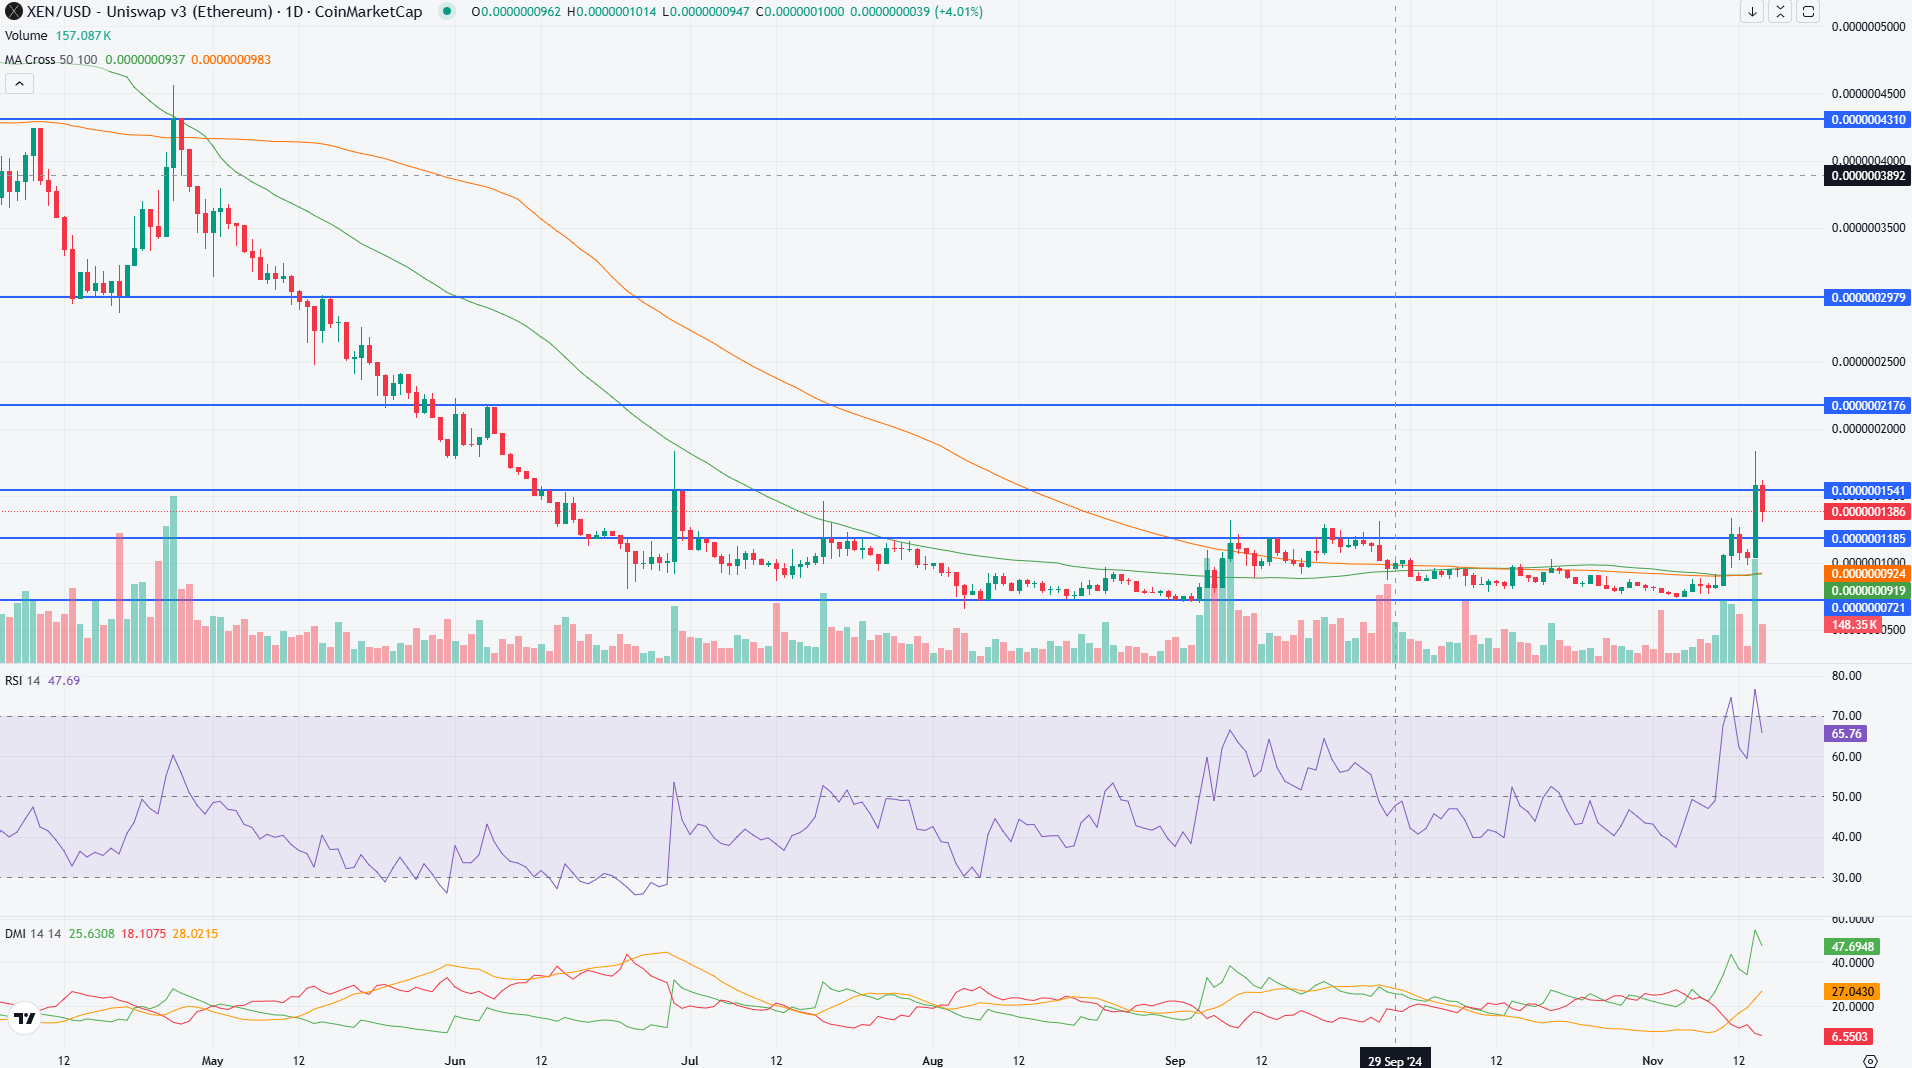
XEN [XEN] crypto has broken out of a multi-month range formation and registered strong gains in the past 36 hours. The daily trading volume doubled on Thursday, the 14th of November, when XEN climbed beyond a 4-month resistance zone at $0.118 (values multiplied by a million for legibility).
The altcoin trades on the smaller exchanges and has not been listed on the top tier exchanges such as Binance, Coinbase, or Bybit.
As such, this gives holders some hope for the future, that such a listing would offer further boosts in visibility and price. The recent breakout and high trading volume could be the beginning of a large rally.
XEN passes beyond one five-month resistance, challenges another
The $0.118 and $0.154 levels have been significant since late June. They were flipped into resistance in the past five months. Despite repeated tests, the $0.118 level has been resolutely defended by the bears until November.
The high trading volume and the bullish belief across the market impelled XEN crypto prices higher. At press time, the $0.154 level was under siege. The RSI was at 65 to show intense bullish momentum on the daily timeframe.
A bearish divergence was not yet seen. Additionally, the token had a fully diluted value of only $18.74 million at press time. During bull markets, and even in bear markets when Bitcoin embarks on sudden rallies, these low-cap tokens tend to explode in value.
Therefore, holders should weigh their situation carefully- can they afford to be greedy, or are they happy to cash out with profits and not look back?
The Bitcoin dominance chart was in a strong uptrend. This weekly timeframe outlook showed that the crucial 60% threshold was flipped to support.
Realistic or not, here’s XEN’s market cap in BTC’s terms
The last time we saw a true altcoin season was in January 2021, and it lasted till November after BTC.D fell from 60.4% to 39.66%. Perhaps holders can wait for a similar BTC.D downward move before cashing out on XEN crypto.
Disclaimer: The information presented does not constitute financial, investment, trading, or other types of advice and is solely the writer’s opinion.


