XLM could follow this path over the next two days if bears seize control

Disclaimer: The findings of the following analysis are the sole opinions of the writer and should not be considered investment advice.
It would be safe to call 20 September an extremely volatile day. The Federal Open Market Committee (FOMC) battled against inflation by raising interest rates since March, and this trend was likely to continue.
Investors already expected a 75 bps hike, and a hike higher than that could be the trigger for a real sell-off. This matters to Bitcoin [BTC] because BTC followed the S&P 500 in recent months, and the altcoin market tends to follow BTC sentiment. On the short-term price charts, Stellar Lumens [XLM] showed bearish intent.
XLM- 1-Hour Chart
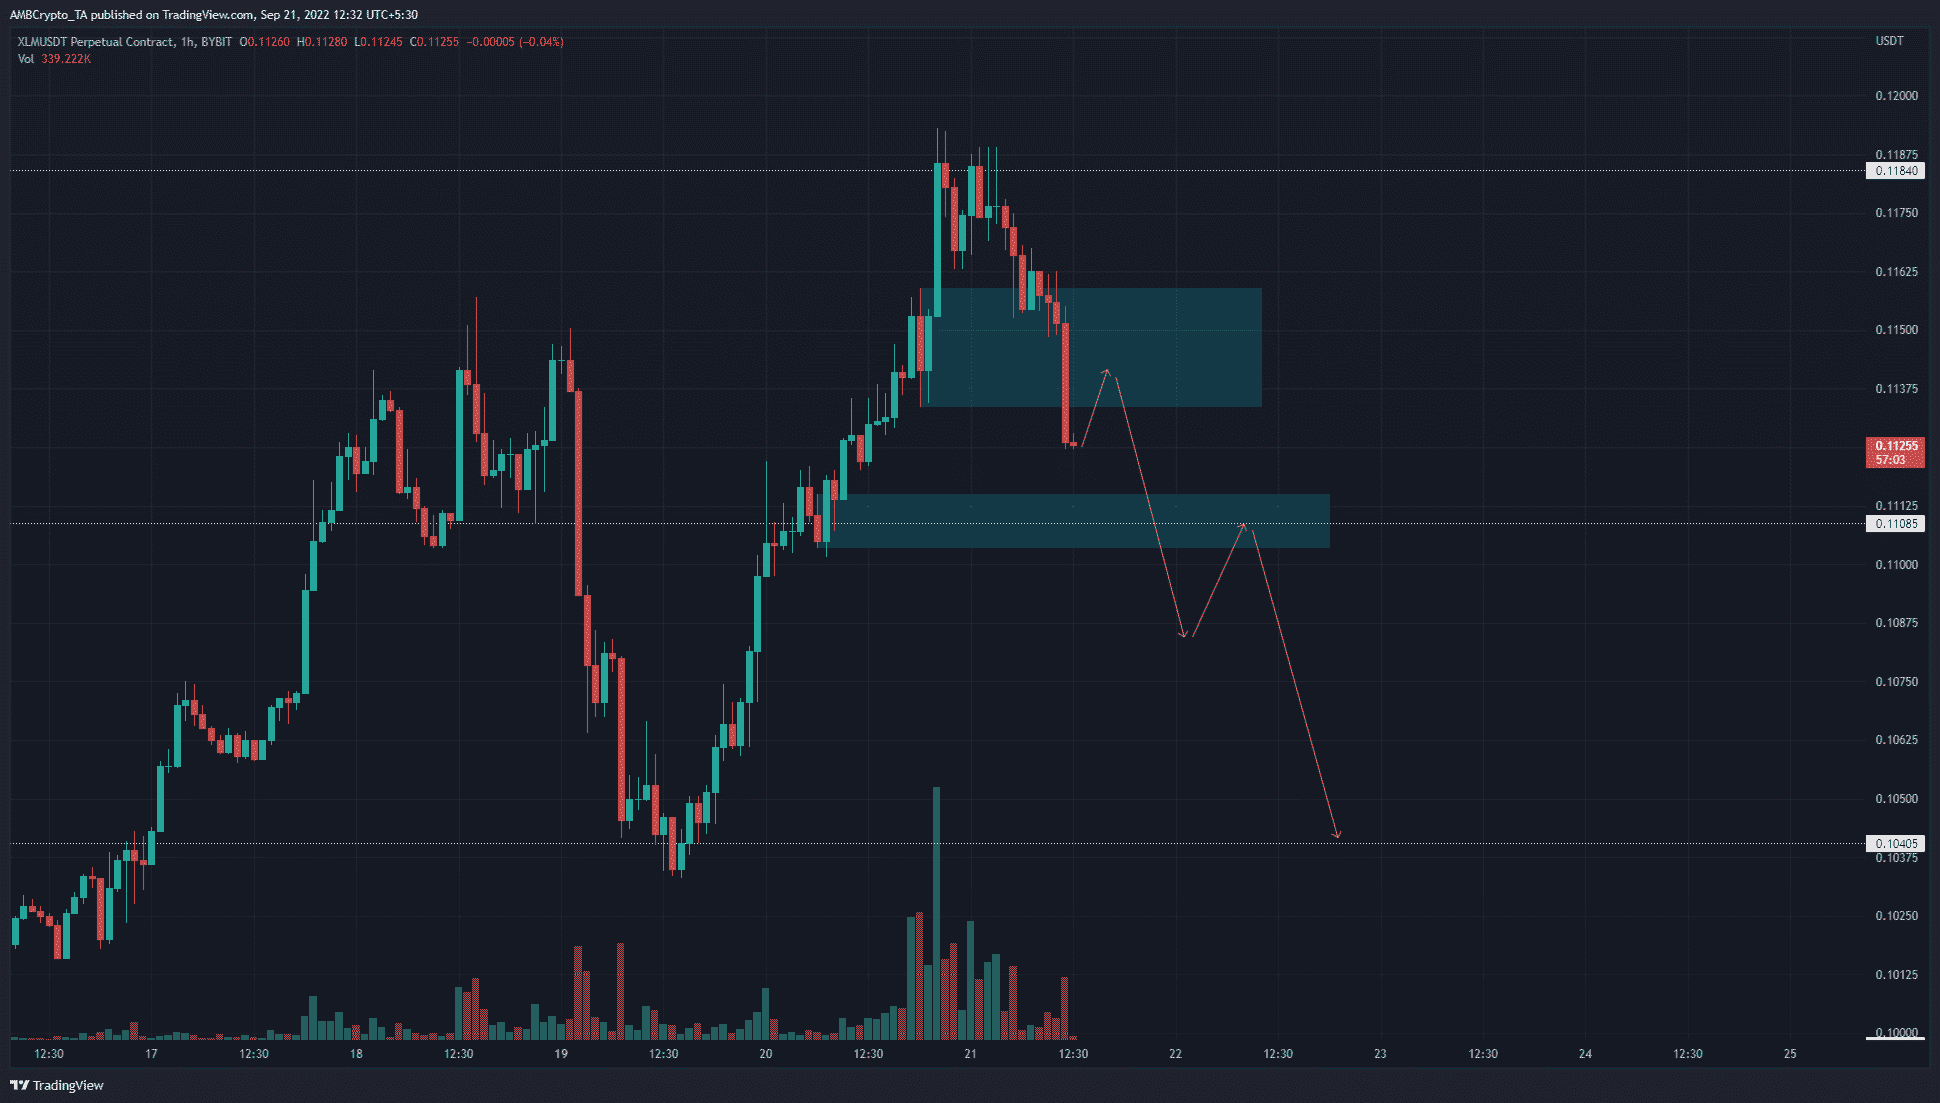
On a higher timeframe, the four-hour chart, the market structure of XLM was bullish. This indicated that on lower timeframes such as one-hour, a trader can be bullishly biased. A bullish order block was seen at $0.115, marked by the upper cyan box.
Unfortunately for buyers, the price crashed right through this order block and could retest it as resistance in the coming hours of trading. This would set up the stage for yet another move downward for XLM.
Another bullish order block was spotted at $0.11. This area was also right at a key support level from July and August. Therefore, it can be expected to act as support once more, but a session close below it would likely presage another leg downward for XLM.
Rationale

The momentum indicators also showed short-term selling pressure. The Relative Strength Index (RSI) slipped below neutral 50 and flipped the bias to bearish. The Awesome Oscillator (AO) was on the verge of falling below the zero line as well.
The On-Balance Volume (OBV) clung to a support level that had been a resistance zone just a few days ago. If the OBV fell below this level, it could point toward seller dominance. Another move downward on the price charts can be anticipated.
Conclusion
It could be that the market has already priced in a 75 bps hike announcement on the federal funds rate. As such, there is the possibility that the crypto markets have already seen a selling wave in anticipation as BTC dropped to $18.8k.
Stellar Lumens needs to recover back above the $0.115 mark and reclaim support. Else, the sellers could quickly gain momentum and force a move as far south as $0.105.