XLM crypto’s 8-day hike – Up by 43.44%, but here’s what’s next for Stellar’s price
The $0.1-$0.103 area has been a significant resistance since August, but Stellar was quick to rocket past it.

- Stellar surged past the $0.097 and $0.103 resistance levels that have been significant recently
- It is likely to target $0.162 and $0.197 next, but short-term volatility can be anticipated too
Stellar [XLM] rallied by 57.22% from 04 November to its high of $0.1415 – A level it reached on 12 November. Since then, the altcoin has retraced by 7.84%. However, the technical indicators were bullish at press time.
In fact, the price action of the token also promised significant gains. XLM is still down 85% down from its all-time high at $0.875, but there is no guarantee it can reach these levels during this cycle.
XLM achieves range breakout in style
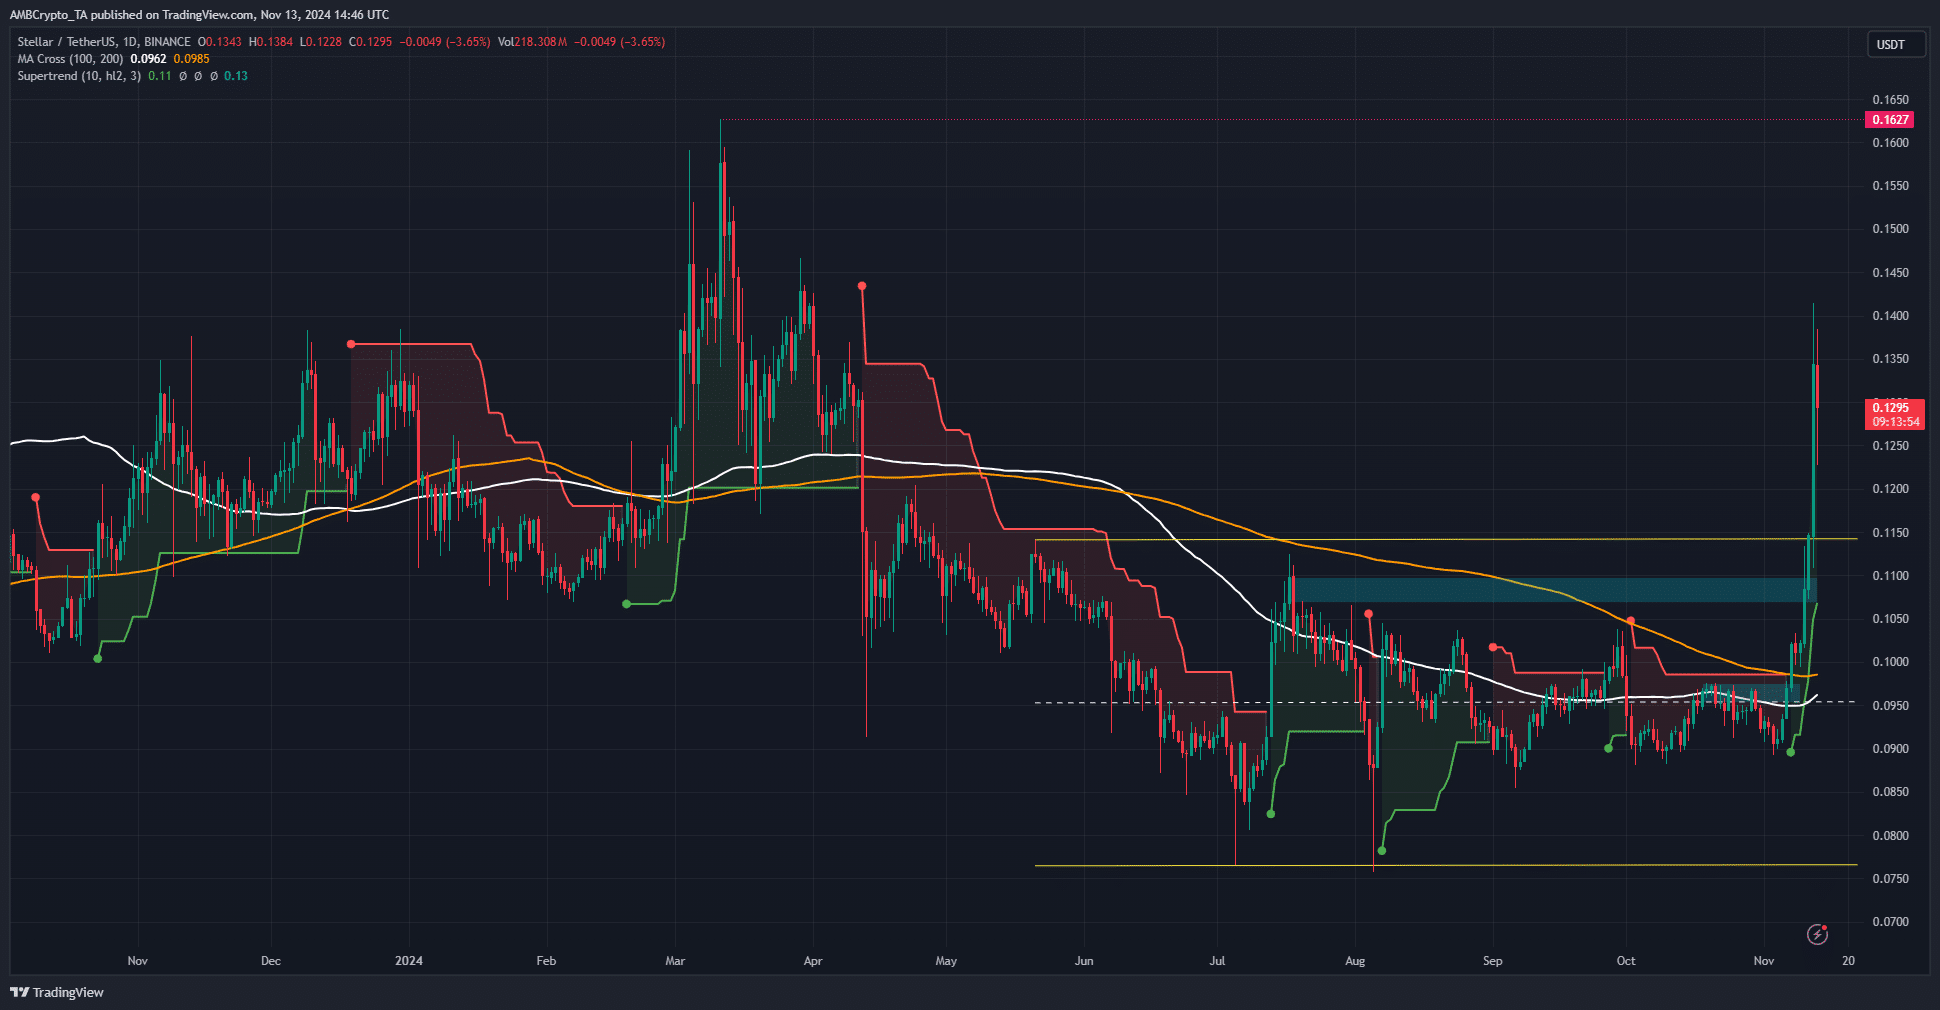
Like many altcoins across the market, XLM crypto broke out of the range formation it has traded within over the past six months. The daily market structure had flipped bullishly when the lower high at $0.097 was breached on 07 November.
The $0.1-$0.103 area has been a significant resistance since August, but Stellar was quick to rocket past it. The explosive move saw the Supertrend indicator flip bullishly and flash a buy signal. It continued to show bullishness, and would turn bearish if the $0.107 support zone is broken.
The $0.107-$0.11 zone were also the highs from July. A retracement to the $0.115 or the $0.11 level would likely be a buying opportunity.
At press time, the 100 and 200-period moving averages had not flipped bullishly yet. However, the price did climb well above them, showing that this golden cross is only a matter of time.
Liquidation levels overhead could cause a cascade
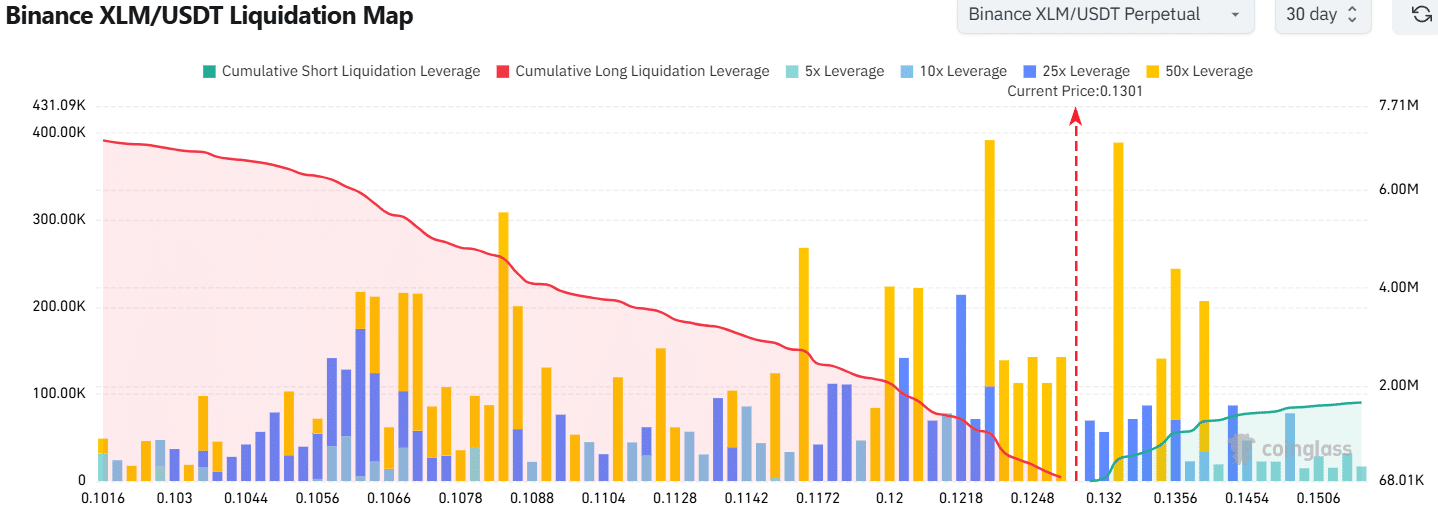
The liquidation map revealed that the $0.1322 and $0.123 levels had a high concentration of short and long liquidation levels respectively. A majority of these were high leverage and close to the market price.
Read Stellar’s [XLM] Price Prediction 2024-25
This makes it easier for Stellar’s price to move to either zone to sweep the liquidity in the area, before continuing the uptrend.
It remains to be seen which zone is visited first, but a dip to $0.123 and $0.115 will likely present buying opportunities. Traders looking to go long should monitor Bitcoin’s [BTC] momentum, while carefully managing the risk.
Disclaimer: The information presented does not constitute financial, investment, trading, or other types of advice and is solely the writer’s opinion