XLM price edges higher, but Stellar’s October slide is proving hard to reverse
Stellar’s latest bounce leaves buyers near familiar lows, with the failed recovery earlier this week offering a useful test for what comes next.



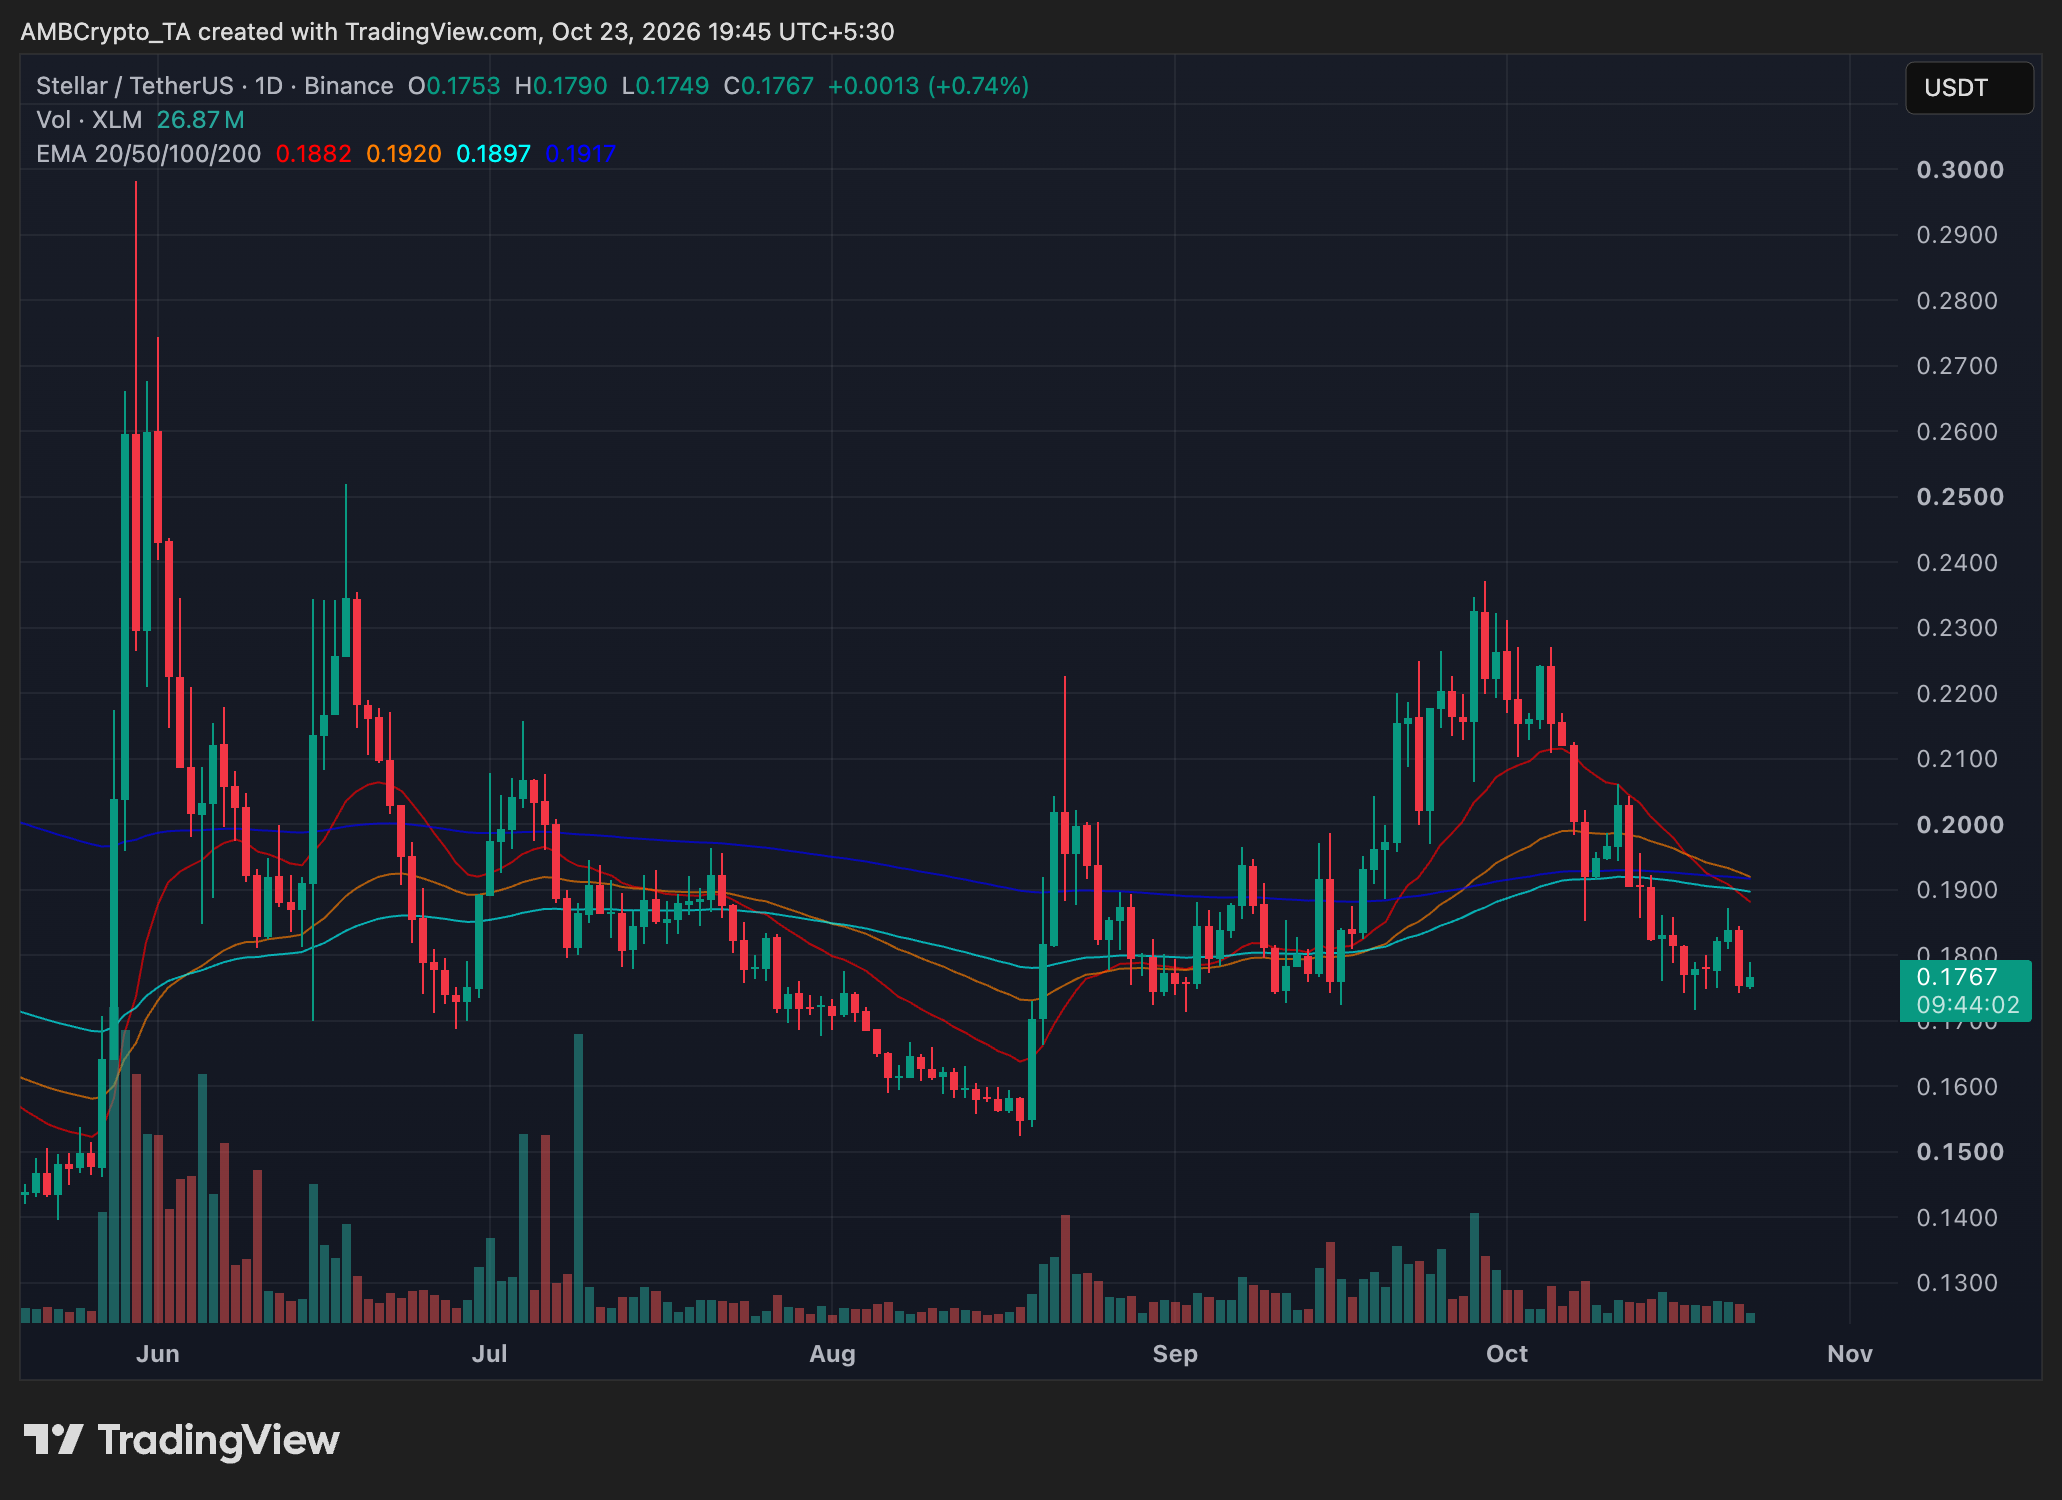
Stellar [XLM] recovered slightly on October 23 after it saw a 4.57% decline the previous day. It was near $0.177 at the time of this writing, having briefly reached $0.179 earlier in the session.
The bounce has helped with its recovery, but it has only recovered a small part of what it lost. With it still below the levels it reached during its latest recovery attempt, buyers have more work to do before October’s negative trend can begin to change direction.
A promising rebound has already faded once
Earlier this week, XLM climbed from around $0.175 toward $0.187. That recovery gave traders some breathing room after several weeks of losses it saw.
But by October 22, the price had fallen back toward the $0.175 price area, taking away much of the advance. The small improvement it saw on Friday leaves its price close to where that rebound started.
The four-hour chart shows the difficulty even more clearly when observed. Throughout October, successive recoveries have generally stopped at lower prices. Buyers have managed to interrupt the decline, but they have not been able to build on those gains.
The daily chart also shows how much September’s strength has faded. XLM traded above $0.23 late that month before slipping below $0.18 in October.
What would make this bounce more convincing?
The first improvement would be if it returns above the $0.179–$0.181 price area, followed by XLM then being able to hold that level as it tries to change the trend into a positive one.
That would put the price above its nearest short-term averages, and it will show that buyers are gaining some control.
But the harder test lies around the $0.184–$0.187 price area, because that was where the latest rebound ran out of steam. Moving through that area would interrupt the pattern of recoveries ending at lower prices.
Even then, a wider turnaround would require more progress. The daily chart’s longer-term averages remain overhead, clustered around the $0.188–$0.192 price area.
The recent lows still matter
For now, the $0.174–$0.175 price range looks like the area that buyers need to defend. This is because XLM has visited this range repeatedly in recent sessions.
If the price settles below it and it’s not able to recover, the recent lows around the $0.171–$0.172 price area become an area to watch.
If the price falls briefly below the support area, it’s fine, but if it continues to trade below it, it means decline has set in. Until either buyers reclaim higher ground or those lows give way, it will not be able to complete its recovery from its October decline.
Final Summary
XLM’s modest bounce has recovered only a small portion of its latest decline.
Holding $0.174–$0.175 and recovering $0.181 would improve the immediate outlook.