XLM price prediction: Here’s how to navigate the new range formation
The spot CVD has also trended higher over the past three days, showing steady demand that could fuel a price breakout.
- Stellar Lumens rebounded swiftly from the range lows.
- Strong spot demand and bullish sentiment were key to the reversal.
On Monday, the 5th of August, Stellar Lumens [XLM] fell to a low of $0.0757. A month earlier, when Bitcoin [BTC] fell from $63k to $53k, XLM reached $0.0765 on the 5th of July. Over the past few days, XLM prices have bounced by 34.35%.
This raised the possibility of a range formation for the asset. The recent gains can be partially attributed to the SEC settlement with Ripple [XRP], with XRP and XLM having similarities in solving cross-border payments.
Exploring the Stellar Lumens range formation
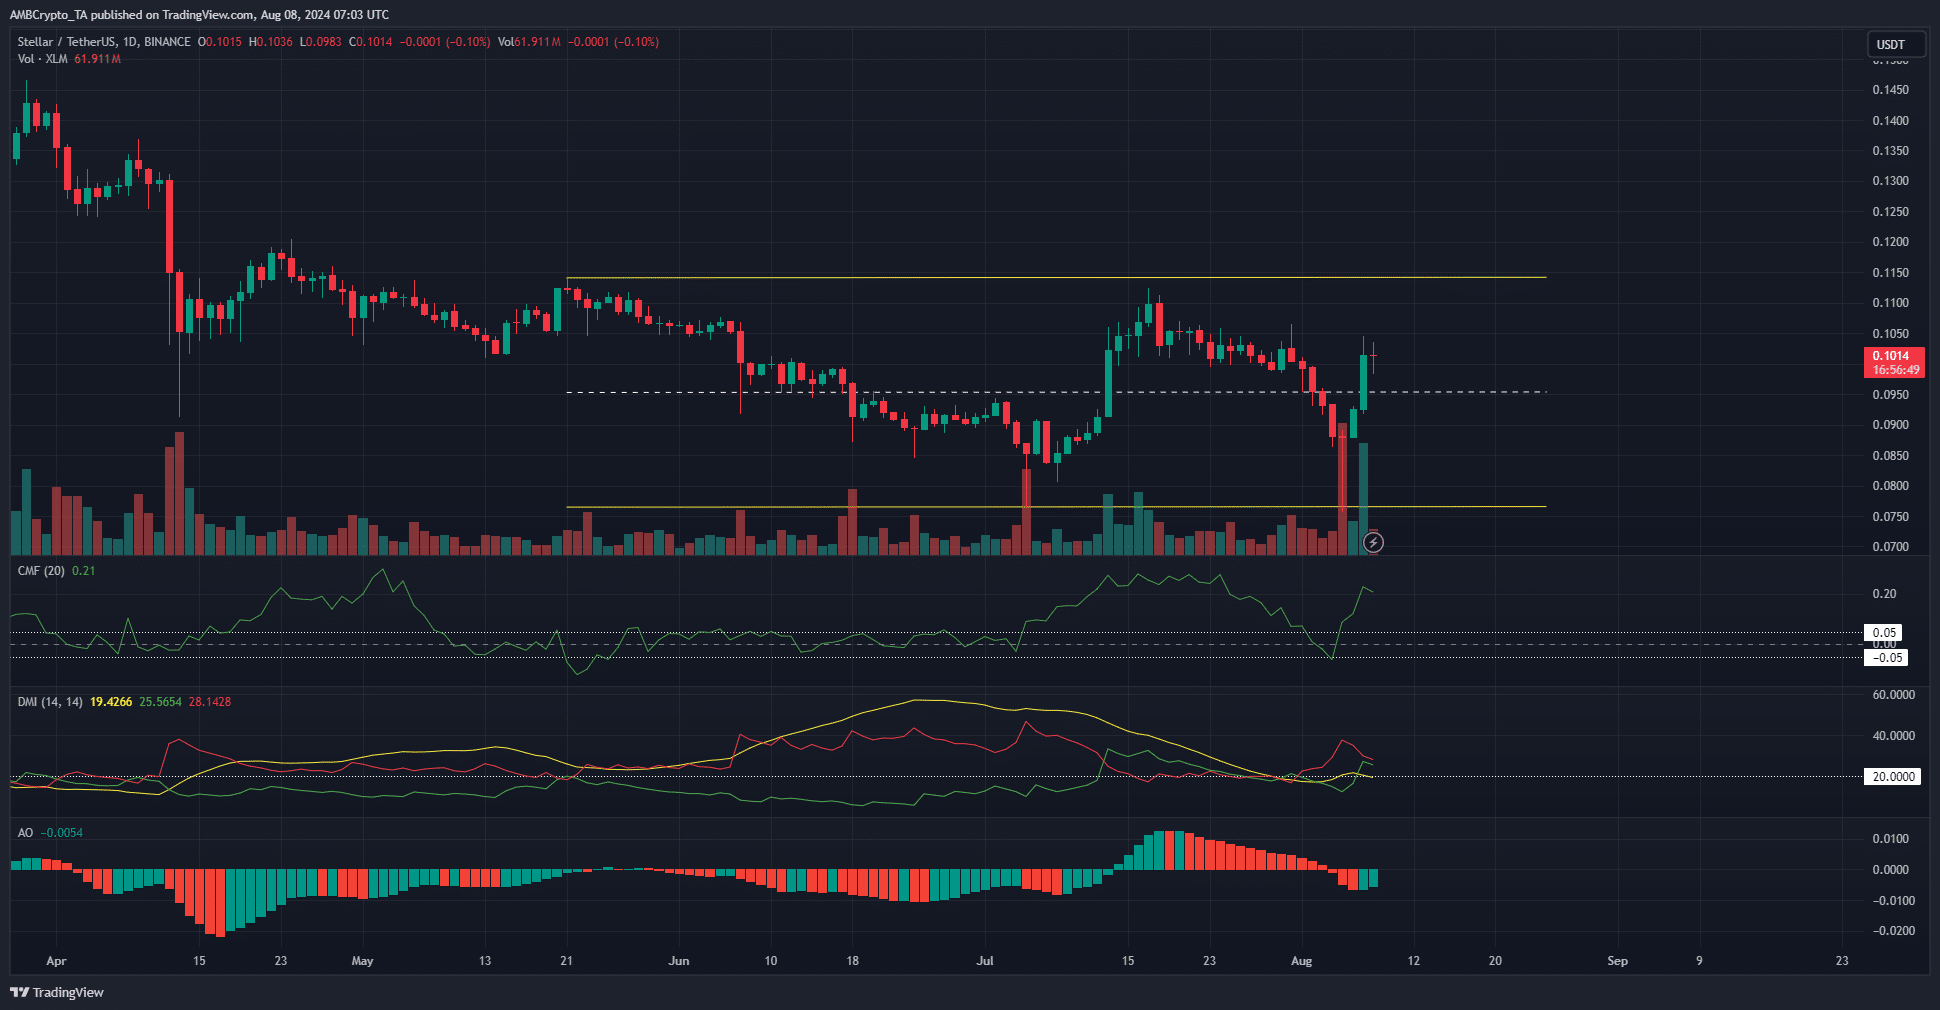
The month-old range (yellow) reached from $0.0765 to $0.1114. The mid-range level at $0.0954 served as support in mid-June and as a resistance zone in late June and early July. It has been breached and is likely to act as support from here on.
The CMF was at +0.21 to show large capital inflows to the market, helping prices surge higher. However, the DMI did not show a clear uptrend in progress. The price action also supported this idea.
The most recent lower high for XLM to beat is at $0.1065. A move past this level would flip the structure bullishly, but it is unclear if the range highs would be broken. The Awesome Oscillator showed that momentum was still weakly bearish.
Sentiment and demand were taking a U-turn
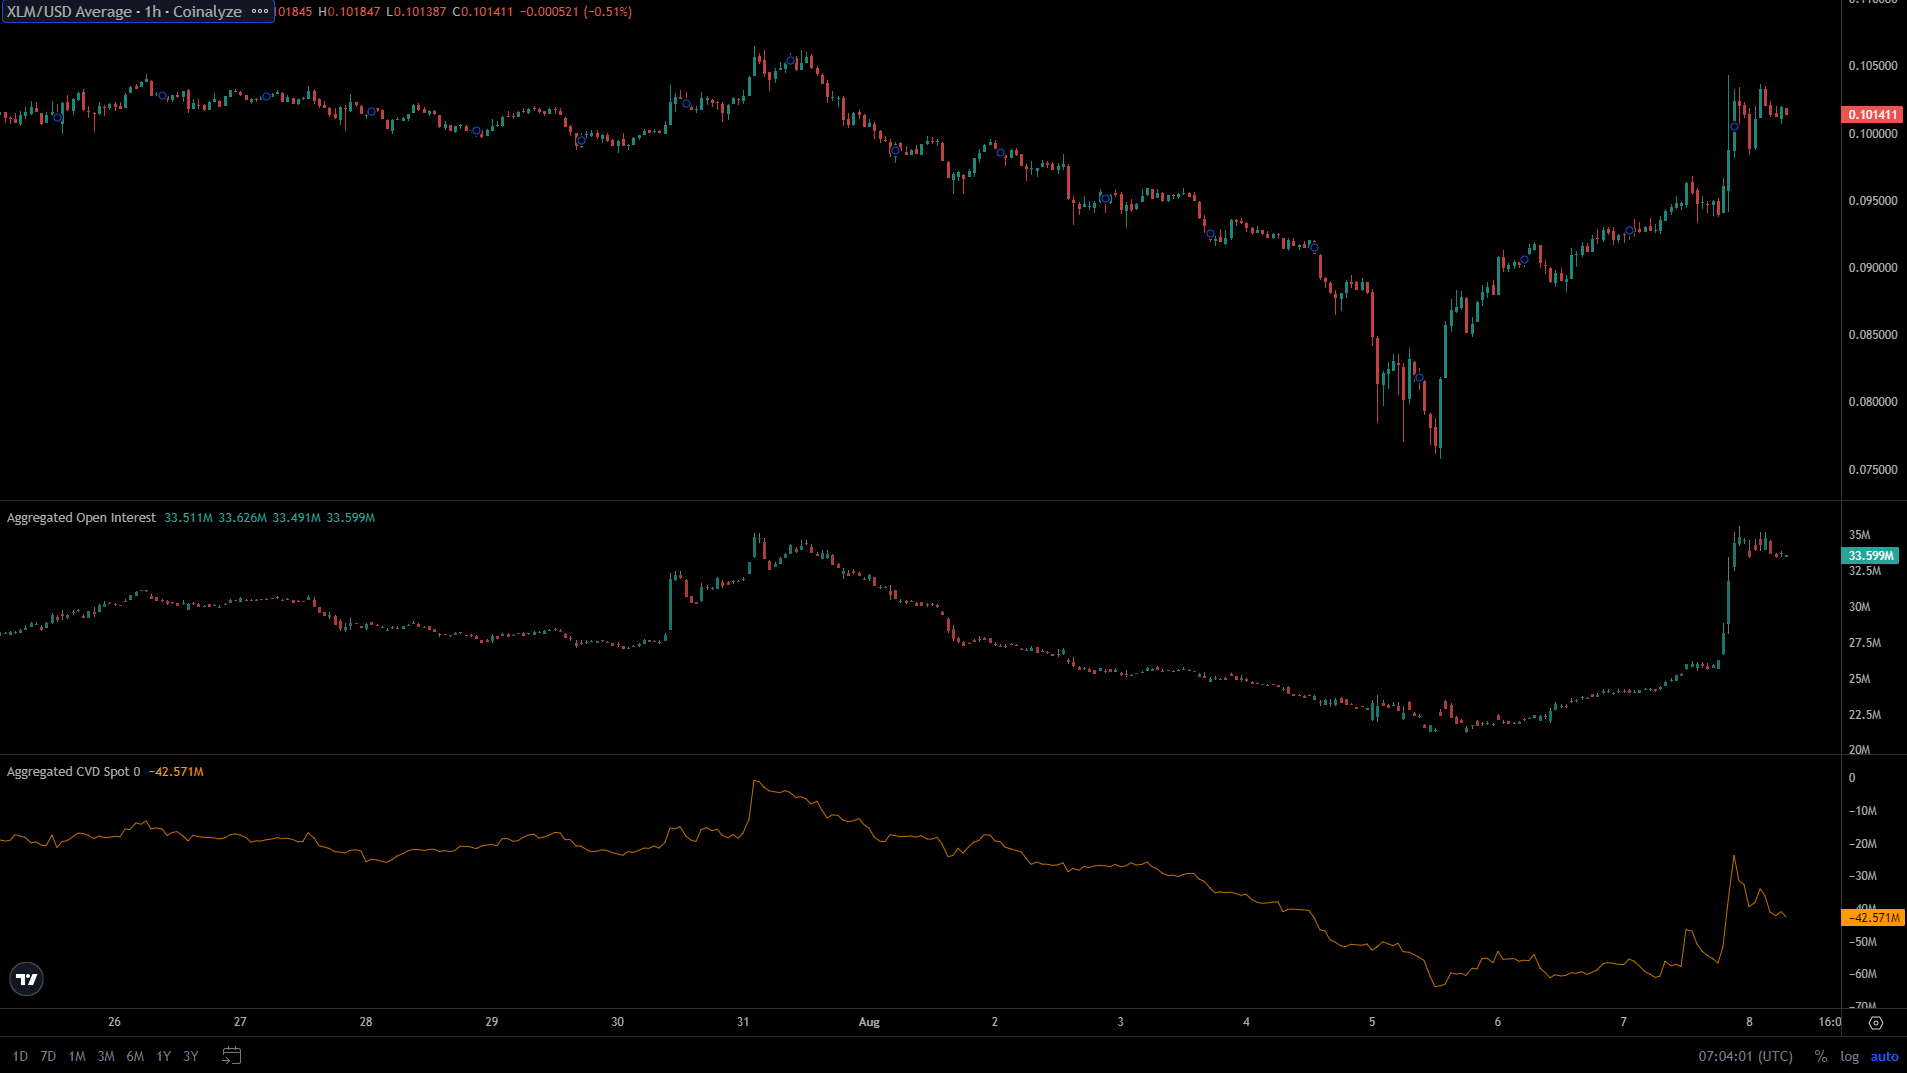
Since the deep price crash on Monday, the Open Interest has climbed higher. It shot upward from $25 million to $35 million on the 7th of August as prices pierced the $0.095 short-term resistance.
Is your portfolio green? Check the Stellar Lumens Profit Calculator
This indicated a strongly bullish sentiment. Additionally, the spot CVD has also trended higher over the past three days, showing steady demand.
This could fuel a breakout past the $0.1114 range highs.
Disclaimer: The information presented does not constitute financial, investment, trading, or other types of advice and is solely the writer’s opinion.