XLM’s ‘Stellar’ performance: Unraveling the why, how, and what’s to come

Stellar Lumens [XLM] hit the highest price point in the last thirty-days, thanks to a push from bulls. Based on reports from CoinMarketCap, XLM reached $0.1188 on 20 September as there was a remarkable increase in its volume. Before the recent rally, the last time XLM was worth something close to that value was on 19 September, when it traded at $0.1160.
However, it seemed that XLM bulls took a chill pill as the price reversed to $0.1154 at press time. The volume did not end with the same state as it was pushing towards an 85% increase in the last 24 hours. At the time of this writing, the XLM 24-hour volume was $310,787,802.
The whys, and hows
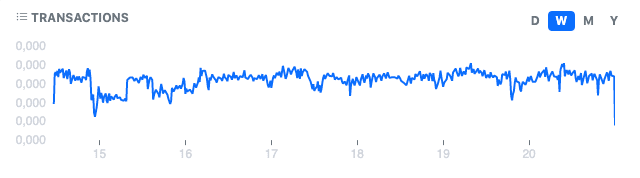
For clear reasons, XLM’s latest price hike would be incomplete without reference to the activities on its network. First, transactions on the Stellar network had impressively increased after some slow movements on 15 September. According to StellarDataFeed, XLM transactions which were at 3,557,034 on the said date increased up to 4,217,397 between 19 September and 20 September.
Stellar #XLM Stats for Sep 19, 2022
Transactions: 4,217,397
Operations: 12,972,367 (3.08 Ops/TX Avg)
Average TX Cost: 0.000889 XLM ($0.000099)— Lumen Loop – Data Feed (@StellarDataFeed) September 20, 2022
StellarChain, showed that activities on its Decentralized Exchange (DEX) had also maintained stability. The blockchain explorer revealed that there had been a total of 3,574,323 on Stellar Lumens DEX. Also, the volume was up to $7,060,460.
What’s happening on-chain and on-charts?
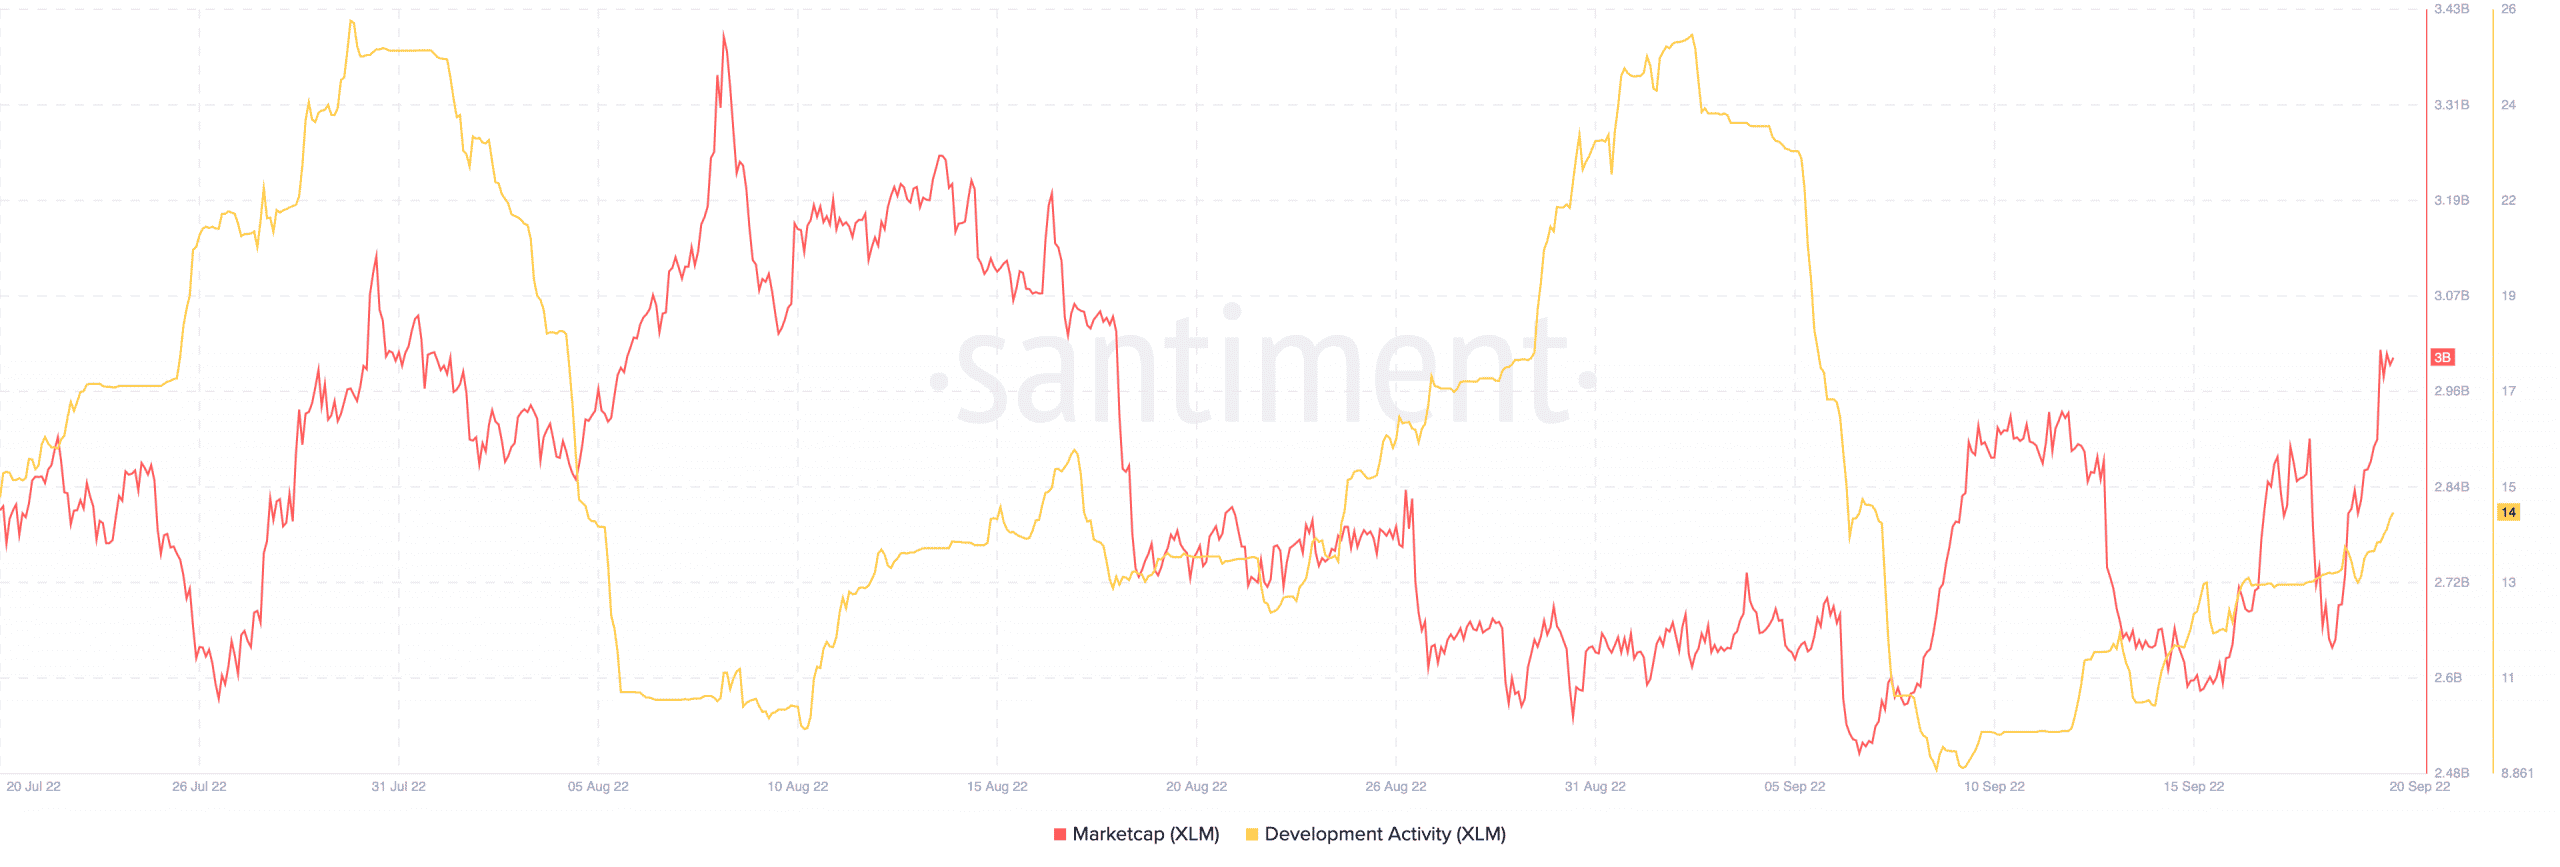
Based on on-chain metrics, XLM’s performance appeared to be fair enough. Its market cap was at $3 billion despite struggling to hold on to $2.5 billion five days back. As for development activity on the chain, it has been impressive lately according to Santiment.
On the other hand, the indications on the four-hour chart showed that XLM was experiencing high selling pressure. The Moving Average Convergence Divergence (MACD) showed that the selling momentum (orange) was stronger than the antics of the buyers (blue). Also, the momentum had shifted to the negative side with its value at -0.00041 below the histogram.
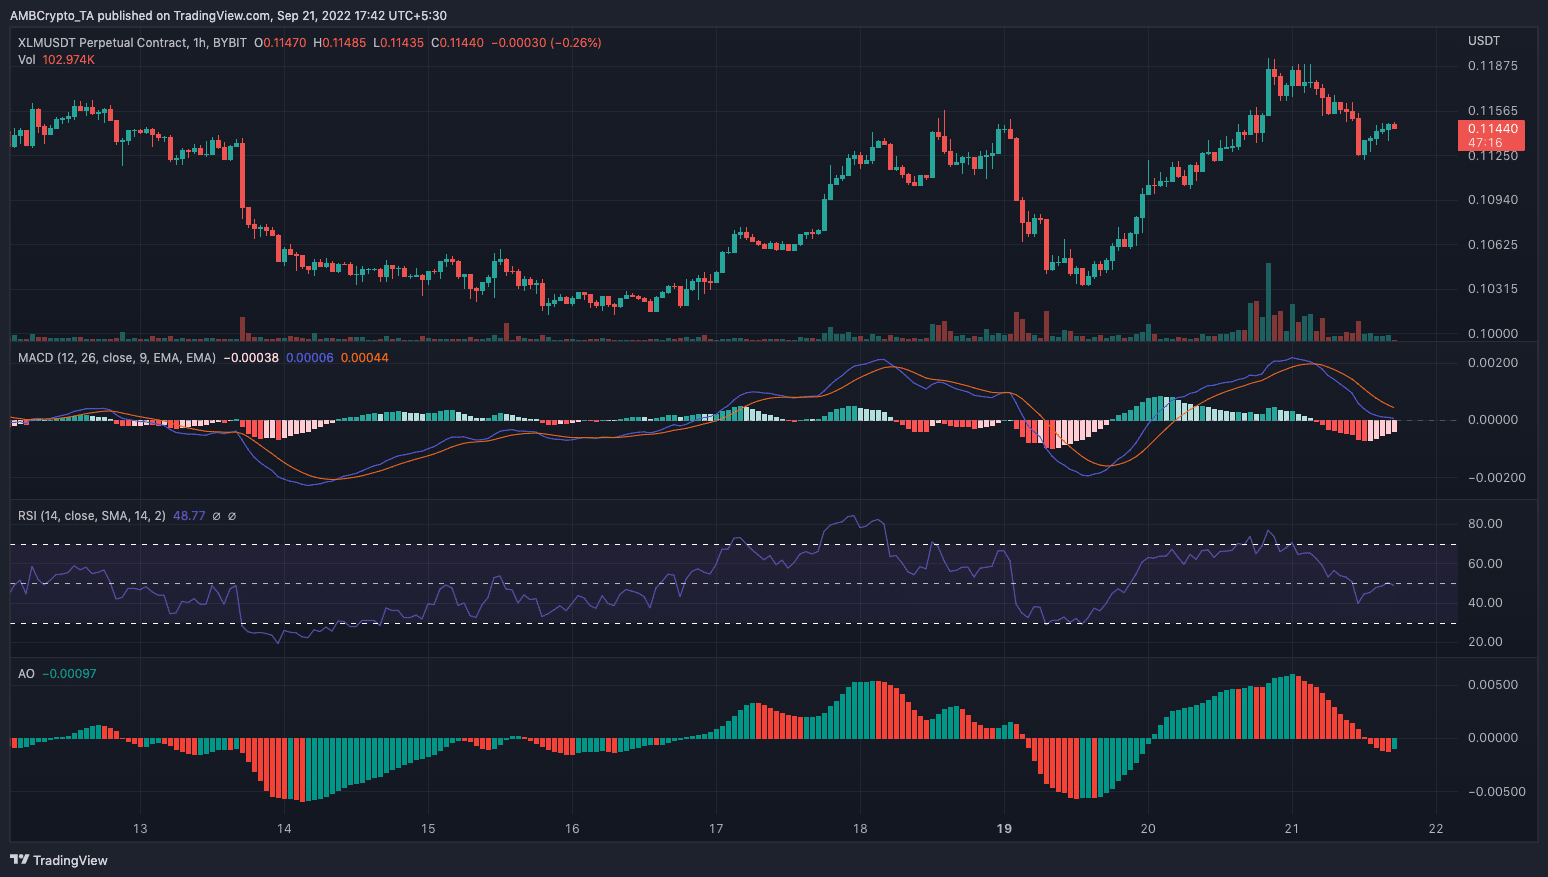
In addition to the MACD revelation, the Relative Strength Index (RSI) indicated the previously strong buying momentum had lost its grip since reaching the overbought level on 20 September.
With the Awesome Oscillator (AO) also reflecting a below equilibrium stance, it is likely that XLM would hold a bearish edge next. Nevertheless, a crypto market revival has the potential to change this projected fortune.