XRP, Algorand, Sushi Price Analysis: 16 December

As the crypto market endeavored to propel a recovery phase, XRP and Algorand saw a down-channel breakout. The near-term technicals of these cryptos, as well as Sushi, exhibited a slight bullish inclination. However, to turn the overall trend in their favor, the bulls are yet to gather more volumes.
XRP
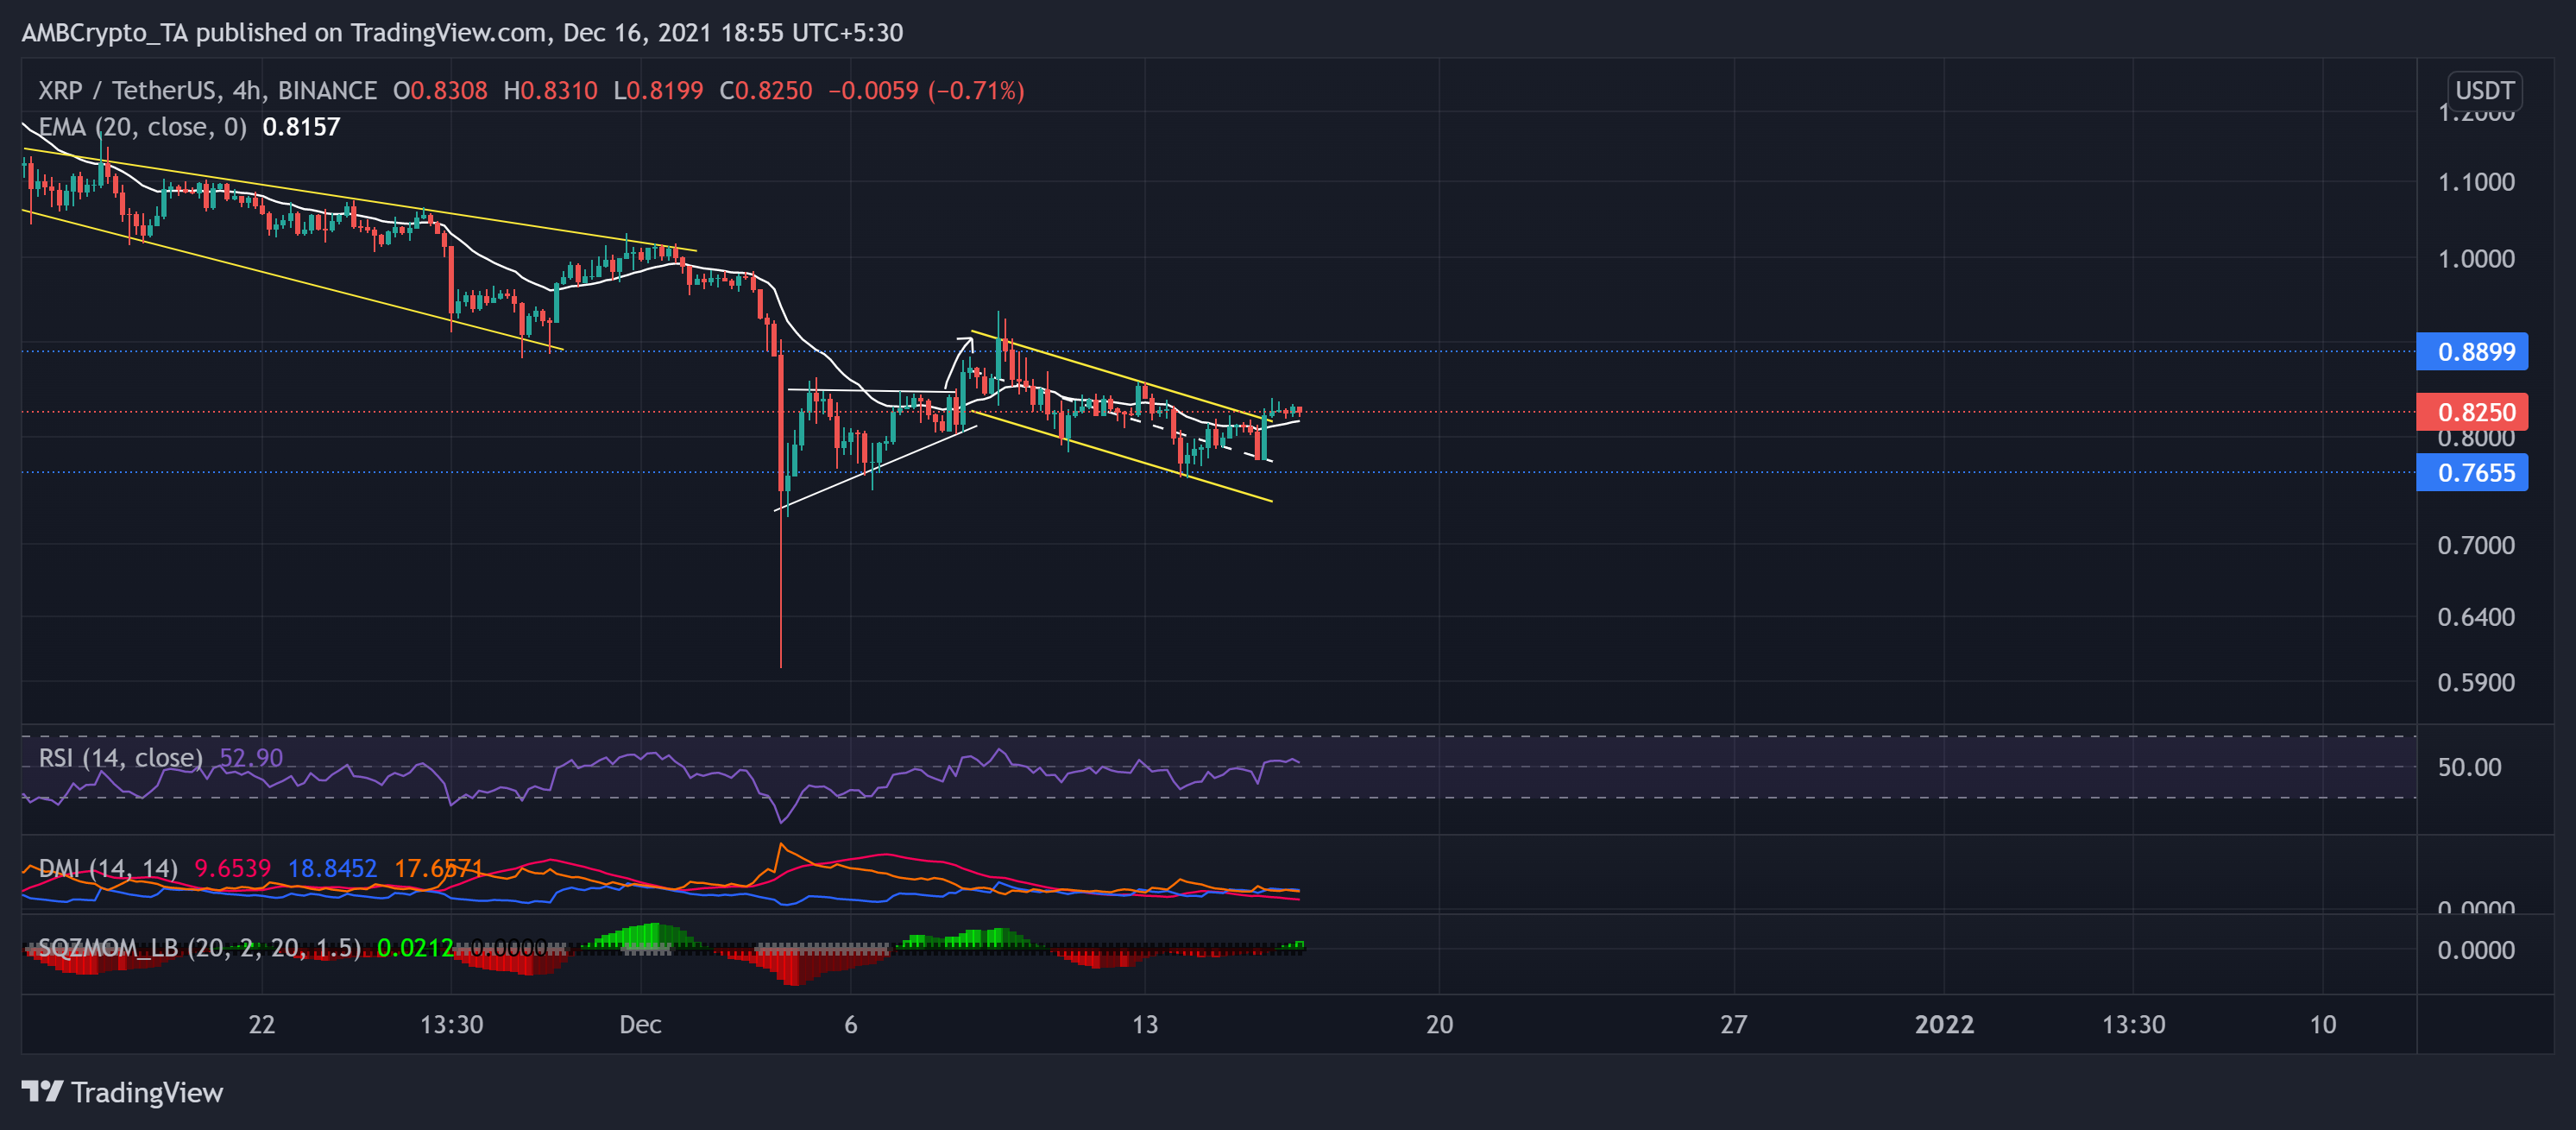
XRP witnessed a down-channel breakout on 16 December after the bulls retested the upper trendline (yellow) thrice. Well, after the 3 December plunge, the alt oscillated between the $0.88-mark (16-week long resistance) and the $0.765-mark.
After hitting its monthly milestone on 10 November, the alt performed quite loosely as it noted a 38.69% loss since then. Now, the 20-EMA (white) stood as the immediate support before a possible upturn. However, as the broader trend was bearish, the bulls will need increased force to turn the tide in their favor.
At press time, XRP traded at $0.825. The RSI was just above the midline after a 14 point surge over the past day. Further, the DMI hinted at a slight bullish preference, but the ADX was drastically weak. The Squeeze Momentum continued to flash black dots, indicating a squeeze phase of low volatility.
Algorand (ALGO)
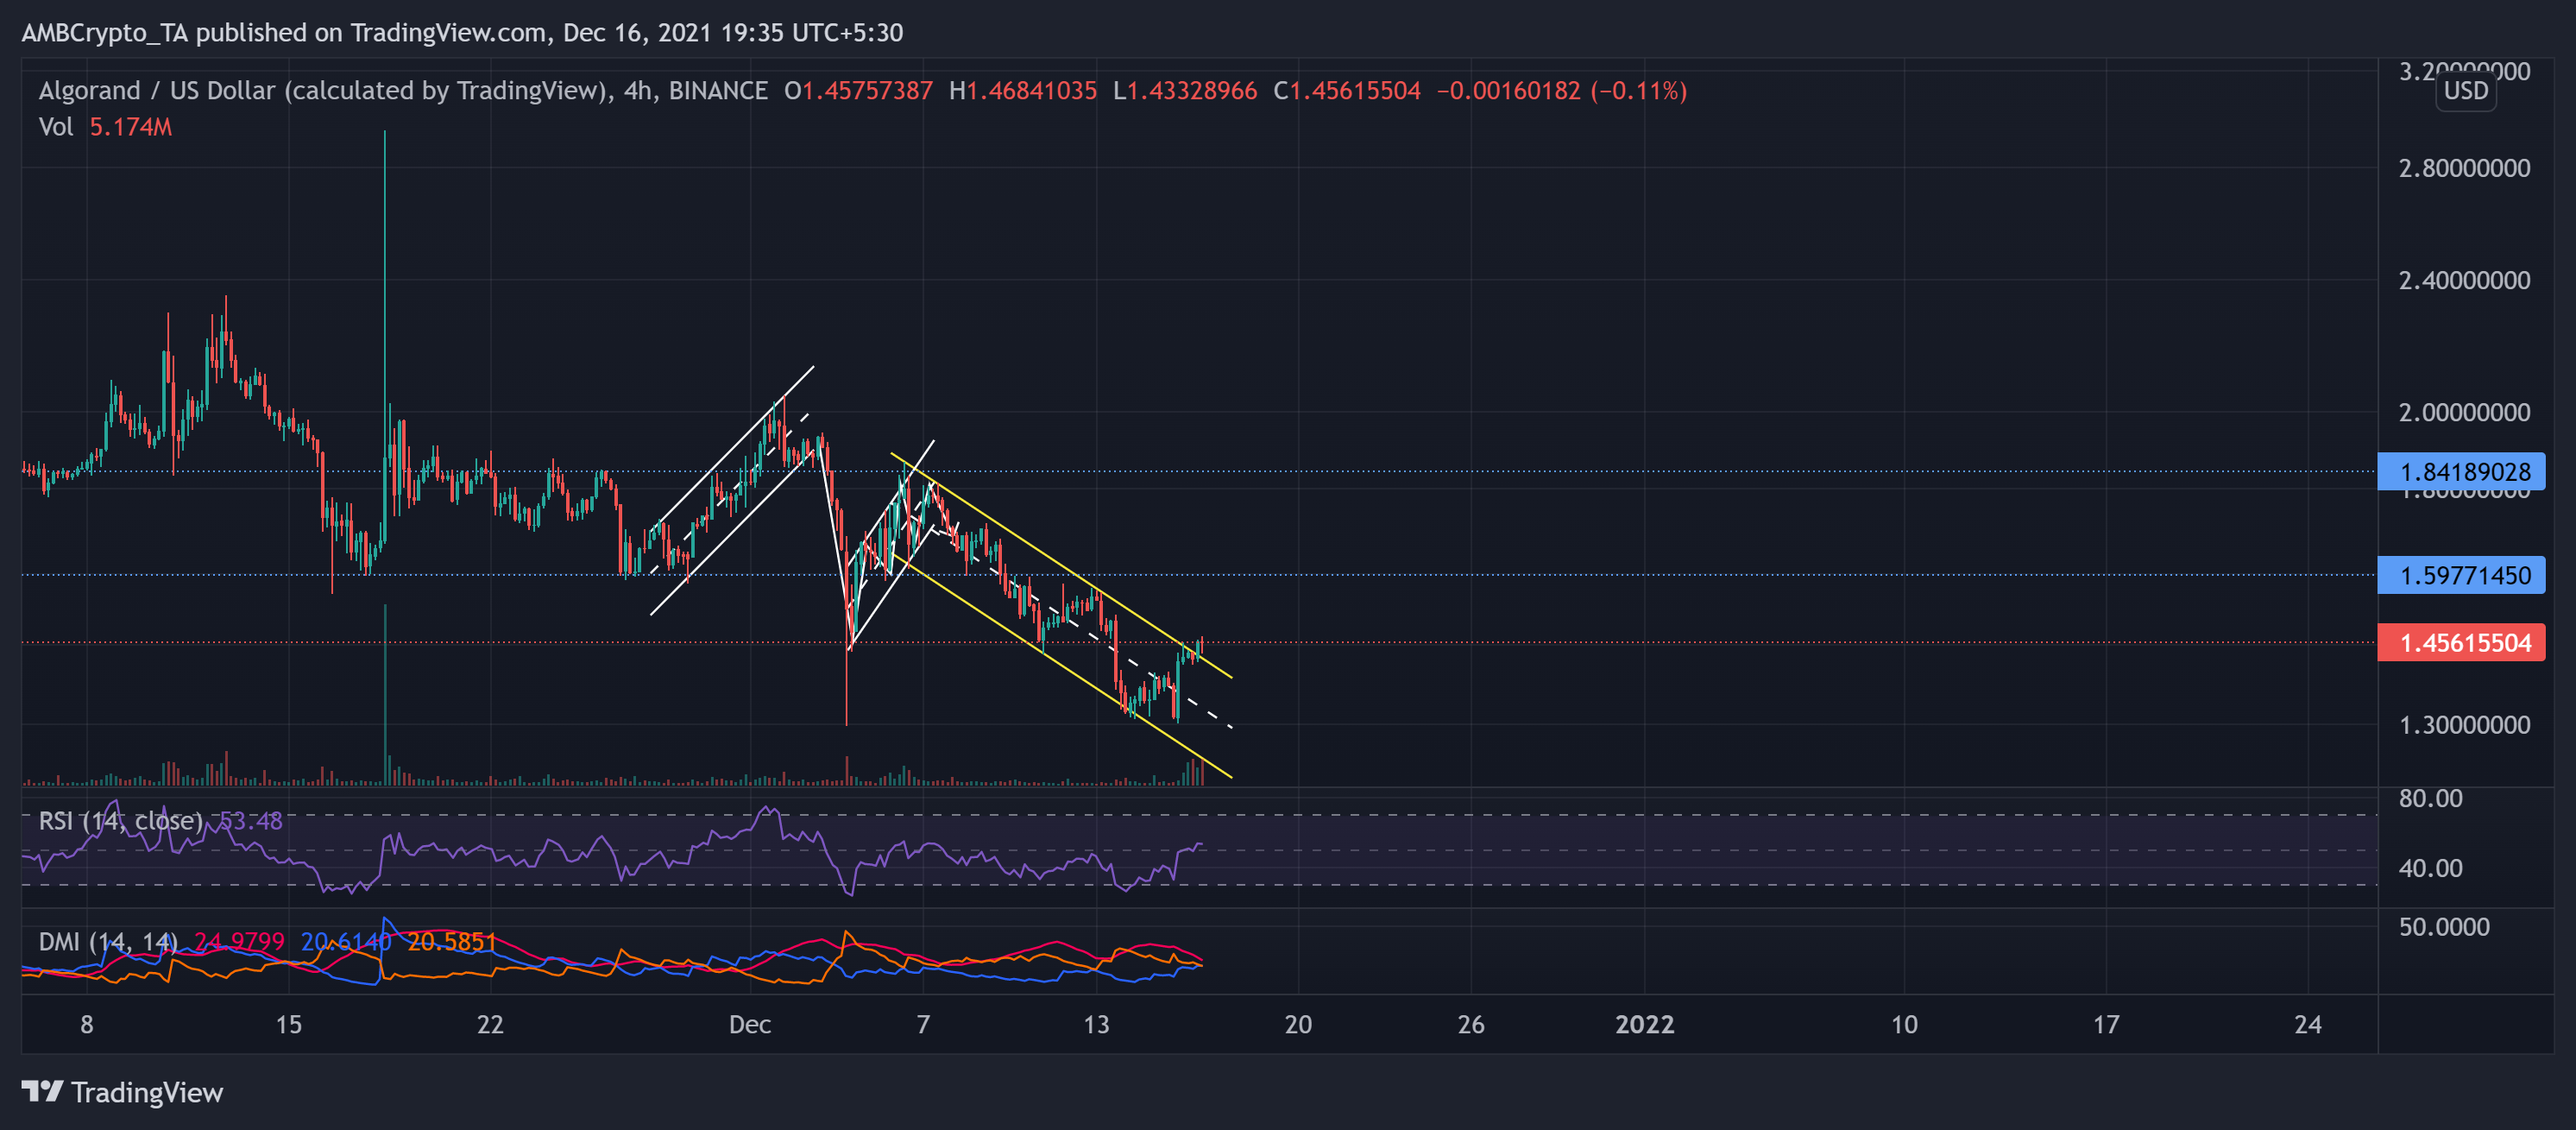
ALGO persistently slackened after poking the $2.94-mark on 18 November. As a result, the price action saw a substantial breakdown, it fell below the $1.84-mark. After forming an up-channel (white), the bulls snapped the aforestated level but succumbed to a broader sell-off on 3 December.
As a result, ALGO formed a bearish flag on its 4-hour chart. Over the past ten days, the price fell in a down-channel (yellow). This fall pushed the price below the three-month resistance at the $1.59-mark. However, At press time, ALGO traded at $1.456 after registering a 7.75% 24-hour gain.
Consequently, it saw a breakout above the upper channel. The RSI slightly chose the bulls after an uptrend over the past day. Also, the DMI lines were on the verge of a bullish crossover. Nevertheless, the ADX displayed a slightly weak directional trend.
SUSHI
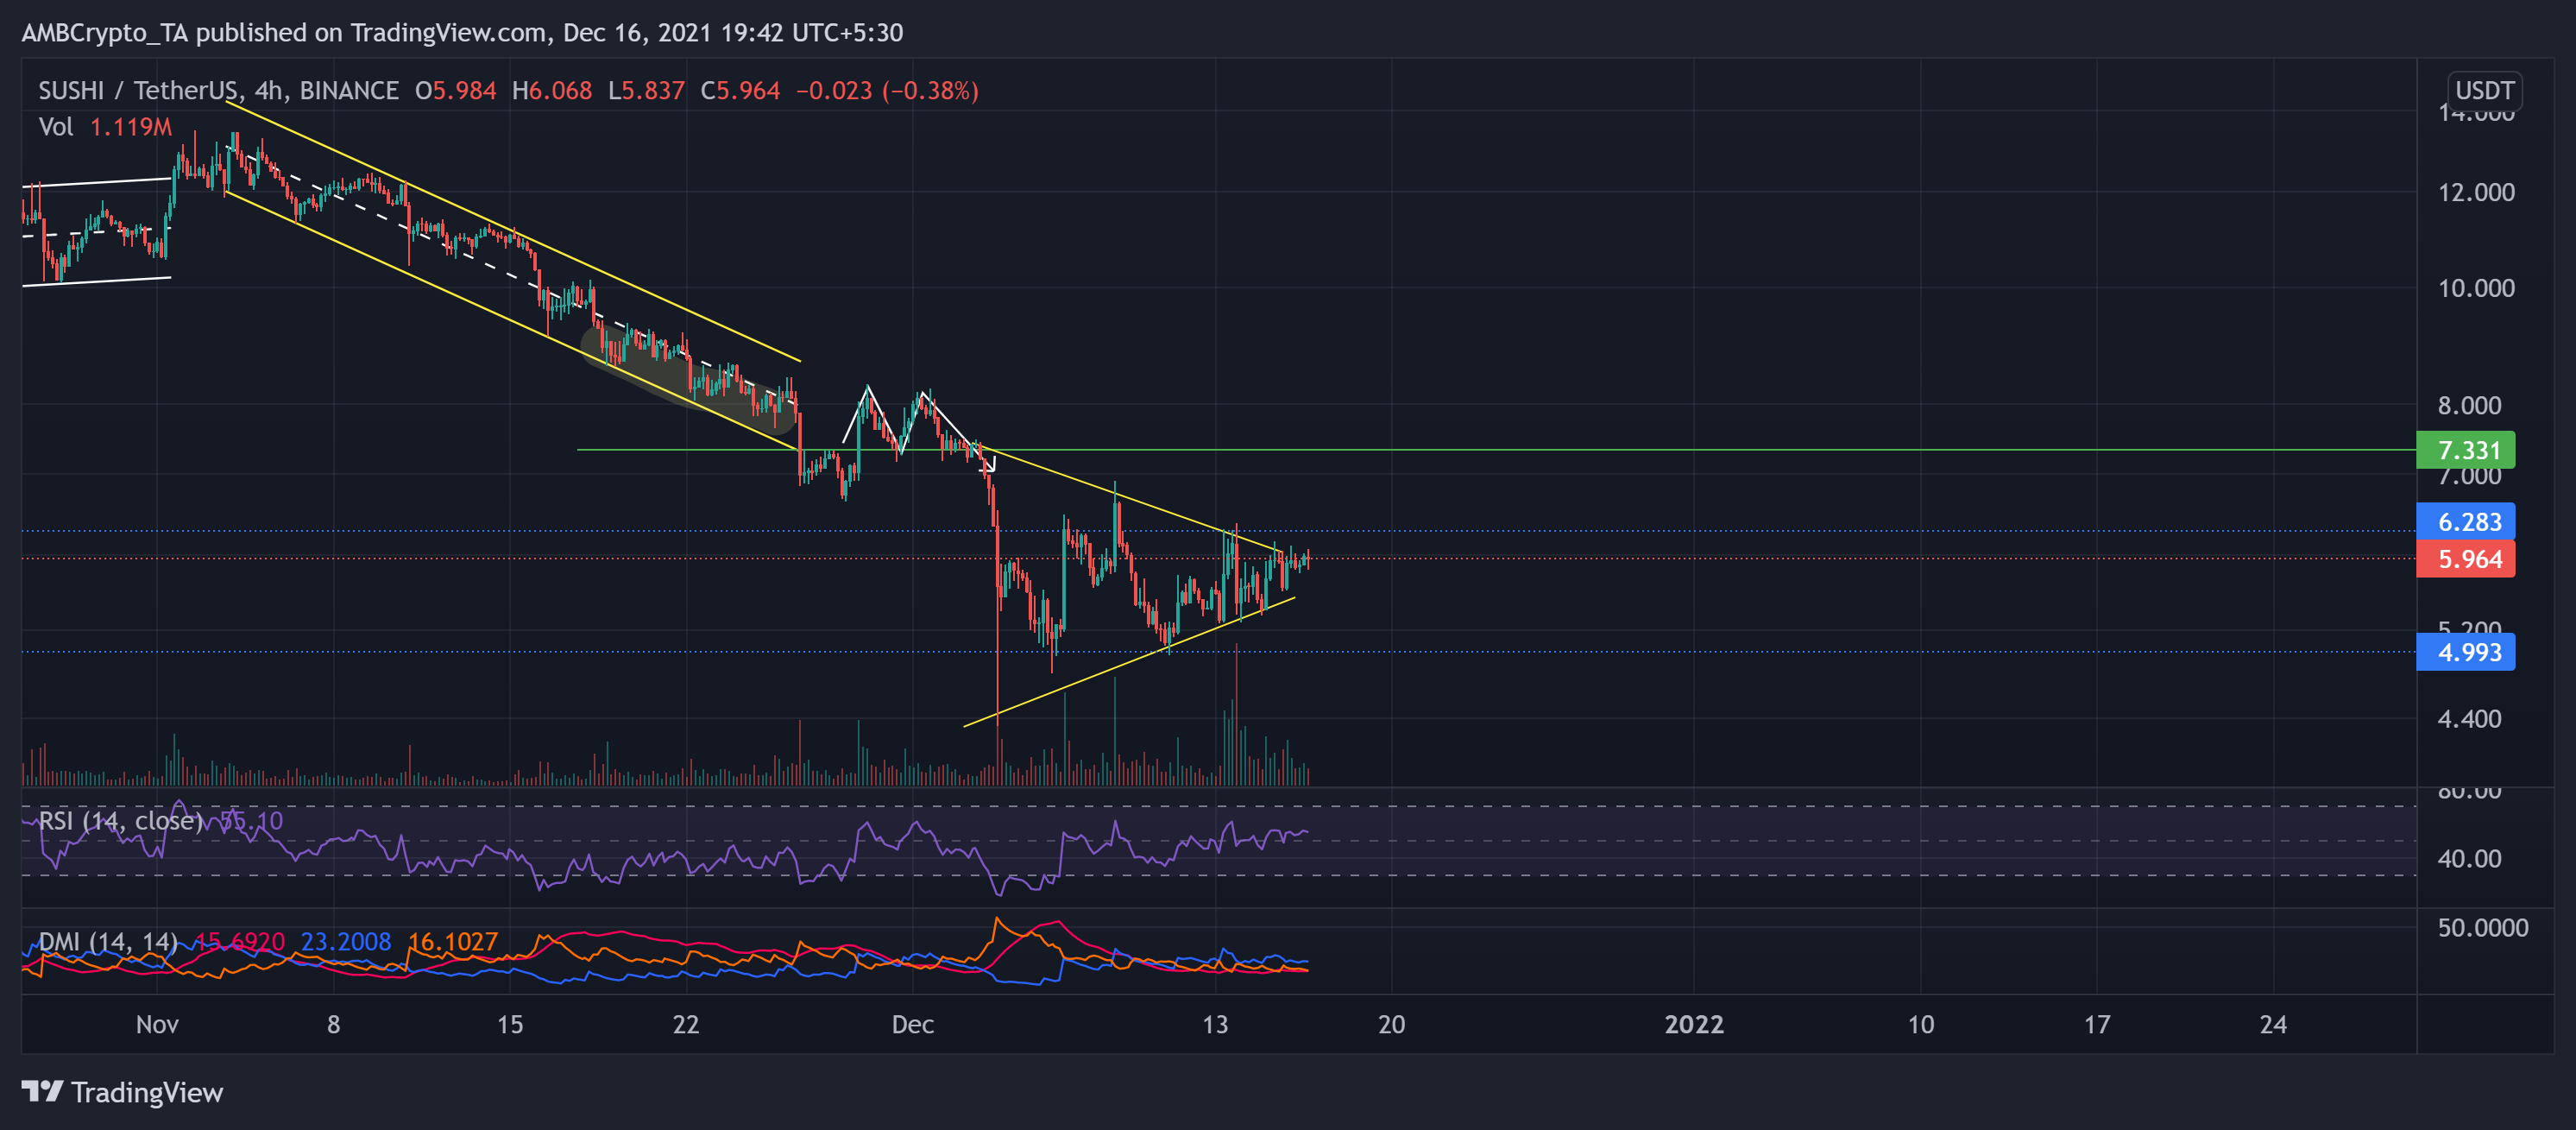
SUSHI steadily downturned in a descending channel (yellow) since early November. As the price, refrained from retesting the upper parallel channel and moved below the midline (white, dashed), it saw a further breakdown in the coming days. Consequently, SUSHI dipped below the 11-month resistance at the $6.2-mark on 4 December.
Over the past 12 days, the alt formed a symmetrical triangle on the 4-hour timeframe. At press time, SUSHI traded at $5.964.
The RSI was at the 54-mark skewing in favor of the bulls. While the DMI flashed a bullish preference, the ADX displayed a weak directional trend.