- In case of a bullish breakout, XRP might reach $0.94.
- However, a few metrics and market indicators looked bearish.
Ripple [XRP] bears have been dominating the market for quite a few weeks now. However, the entire scenario might change soon, as a long-term pattern appeared on the token’s chart.
Will XRP manage to successfully break above the bull pattern?
XRP’s long-term bull pattern
According to CoinMarketCap’s data, XRP’s price plummeted by more than 4% over the last seven days.
At the time of writing, the token was trading at $0.5659 with a market capitalization of over $31.7 billion, making it the seventh-largest crypto.
Interestingly, AMBCrypto’s analysis of the token’s weekly chart revealed that a bullish symmetrical trading pattern had emerged on XRP’s chart.
The pattern formed in December 2021. Since then, the token’s price has been consolidating inside it. At the time of writing, it seemed that the token might break above the pattern in the upcoming weeks.
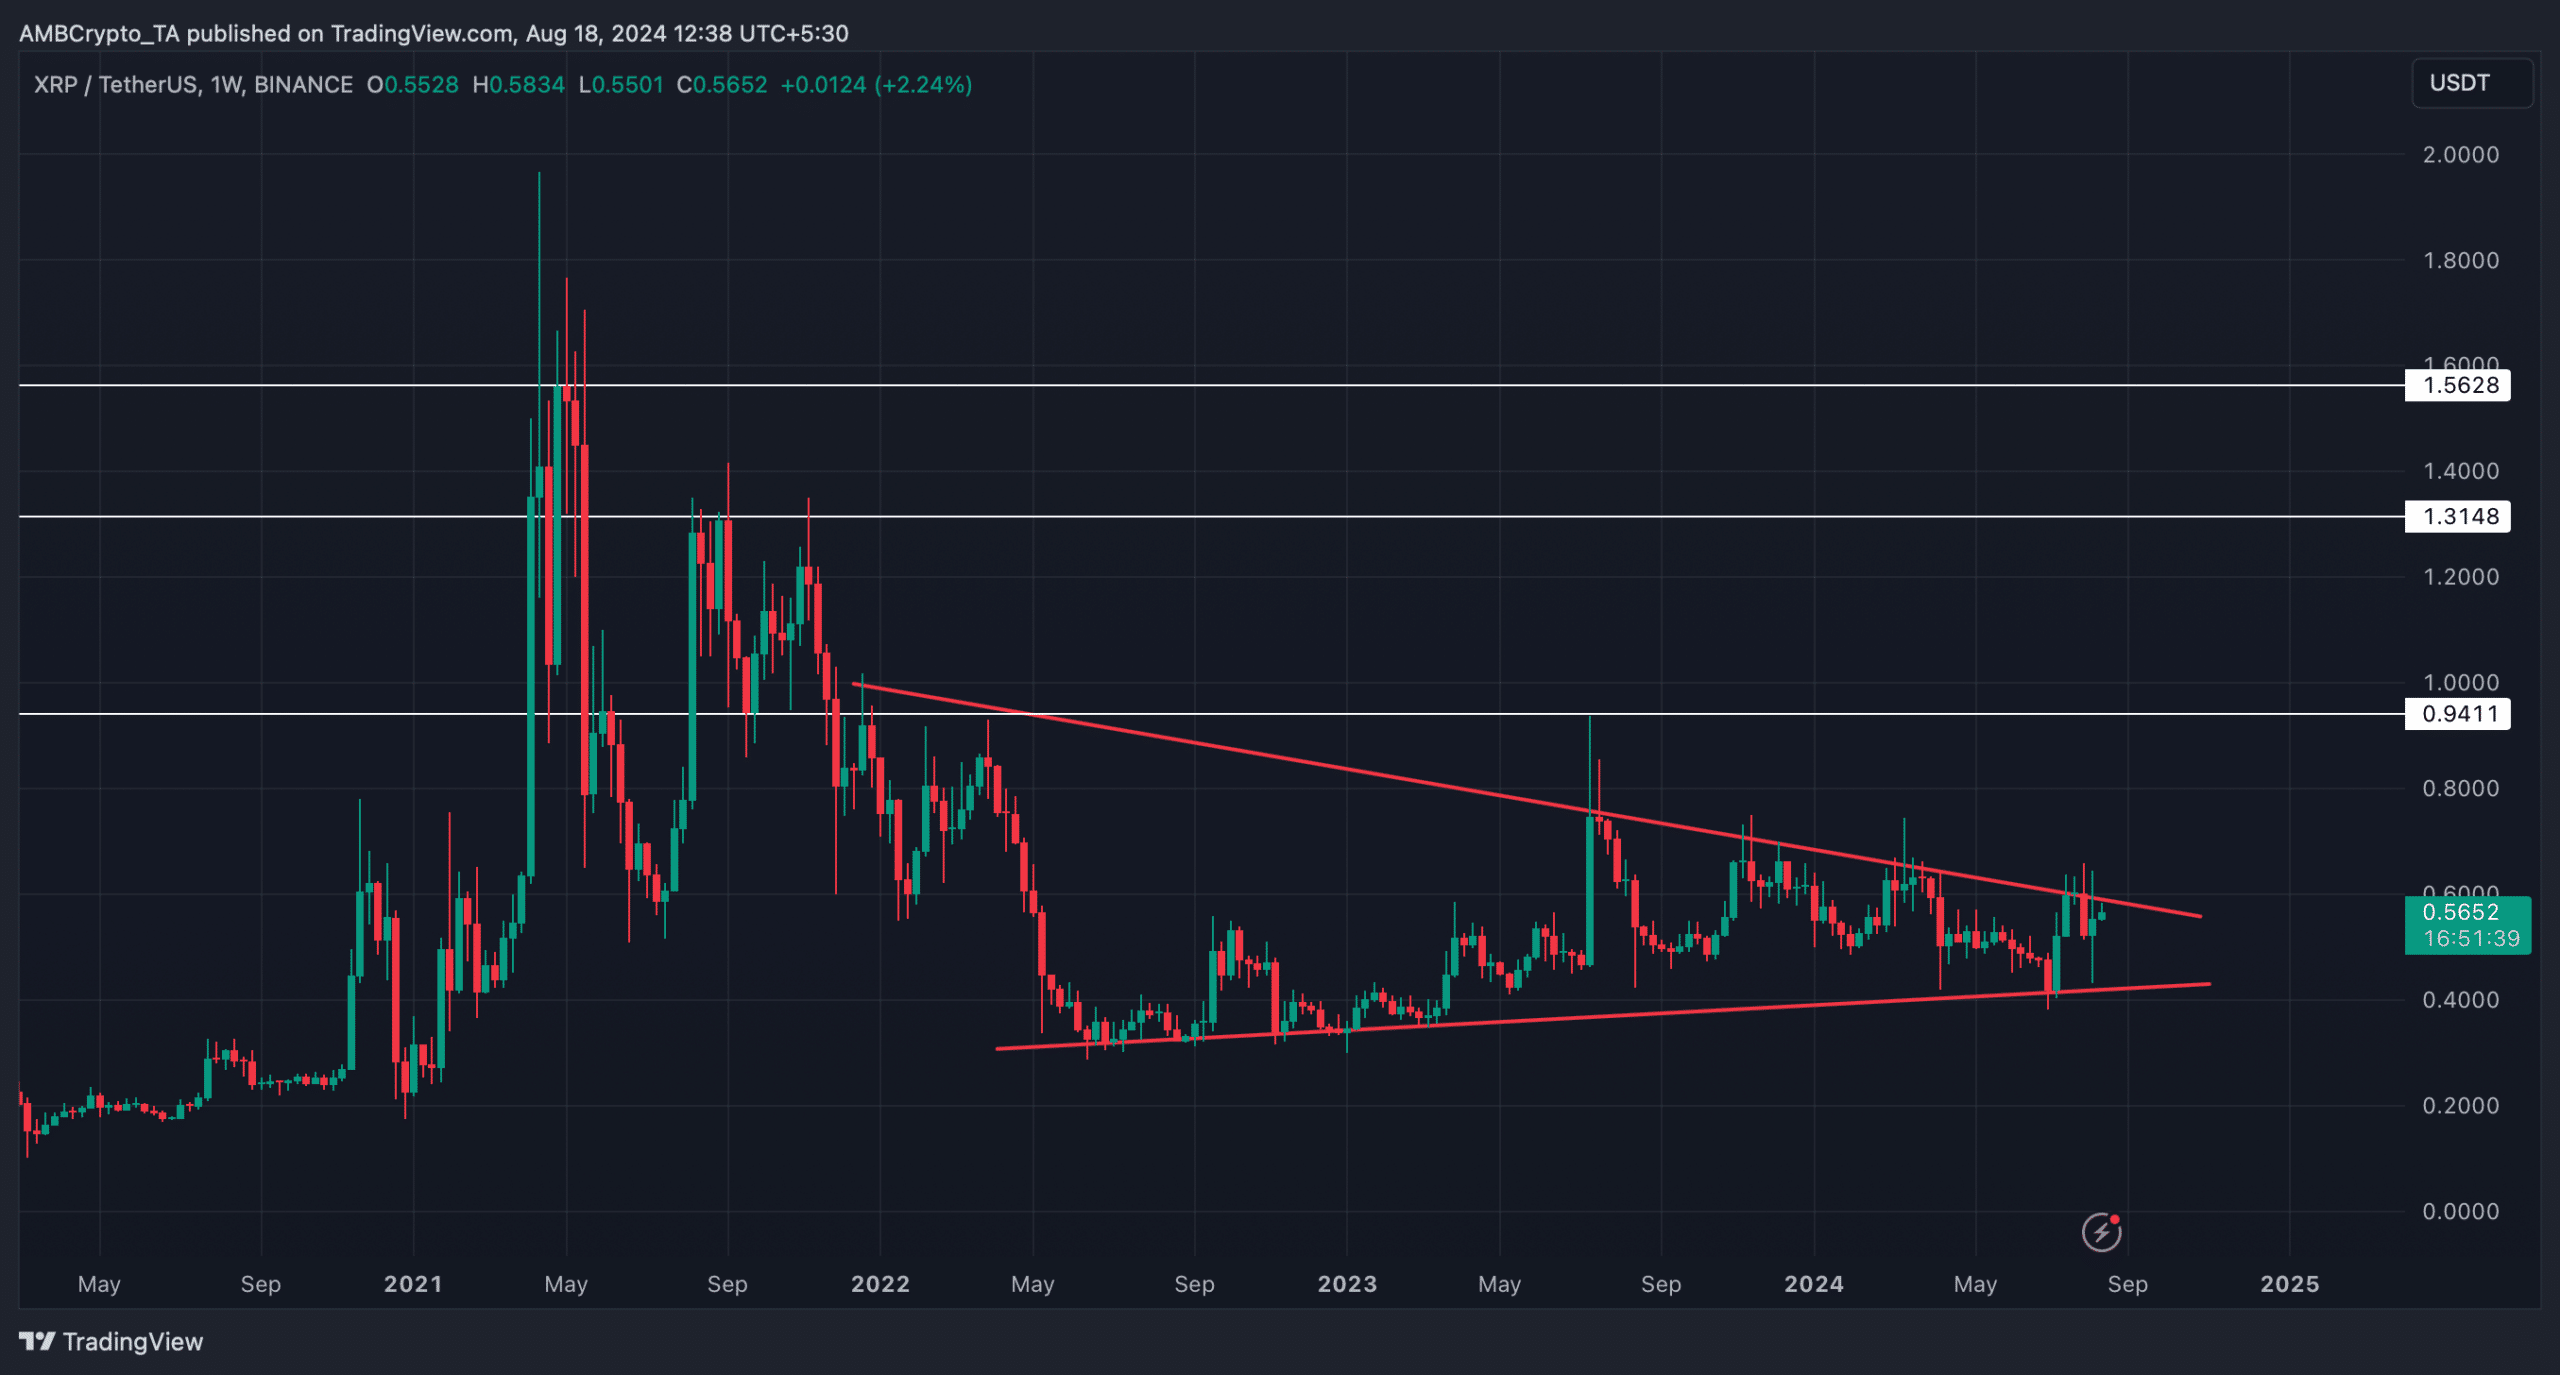
Source: TradingView
If that happens, investors might see XRP grow exponentially and reclaim its past glory. First, it might target $0.94. Then the next target would be $1.31.
A breakout above that level would allow the token to retest its all-time high, and in a utopian situation, even exceed that.
Will the token break out in Q3?
Since the aforementioned bullish pattern hinted at skyrocketing growth, AMBCrypto checked XRP’s on-chain data to see how likely it is for the token to break out in the coming few weeks.
Our analysis of Santiment’s data revealed that buying pressure on the token had increased last week, per a decline in its Supply on Exchanges.
The fact that investors were buying XRP was further proven by the rise in its exchange outflow on the 16th of August.
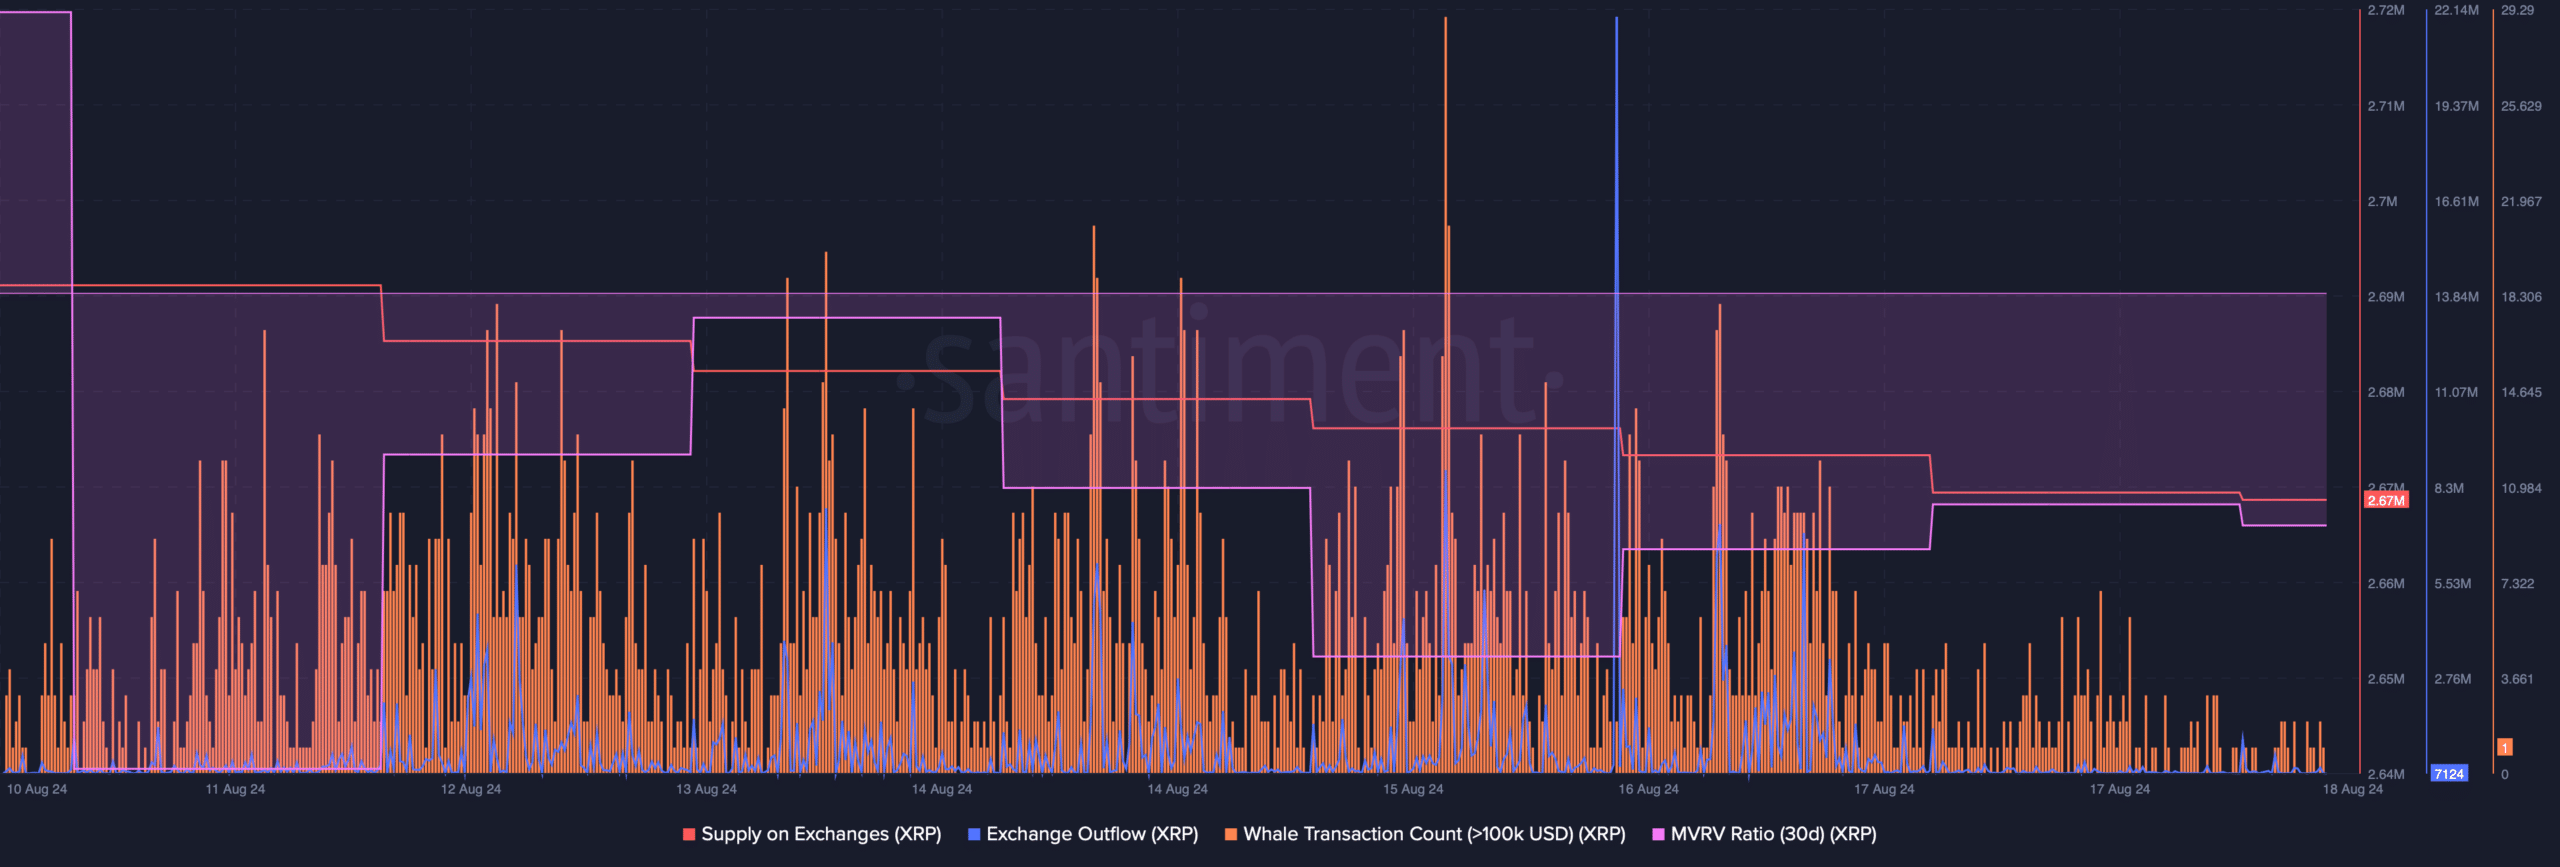
Source: Santiment
However, the rest of the metrics looked pretty bearish. For instance, the MVRV ratio remained in the negative zone. Also, whales were not actively trading the token as the hale transaction count declined last week.
Apart from this, Coinglass’ data revealed that XRP’s Long/Short Ratio declined, which was also a bearish signal.

Source: Coinglass
AMBCrypto then assessed XRP’s daily chart to find out what technical indicators suggested. As per the Bollinger Bands, the token was testing its 20-day simple moving average (SMA).
Read Ripple’s [XRP] Price Prediction 2024-25
However, it might take longer for the token to break above that resistance, as the MACD displayed a bearish advantage in the market.
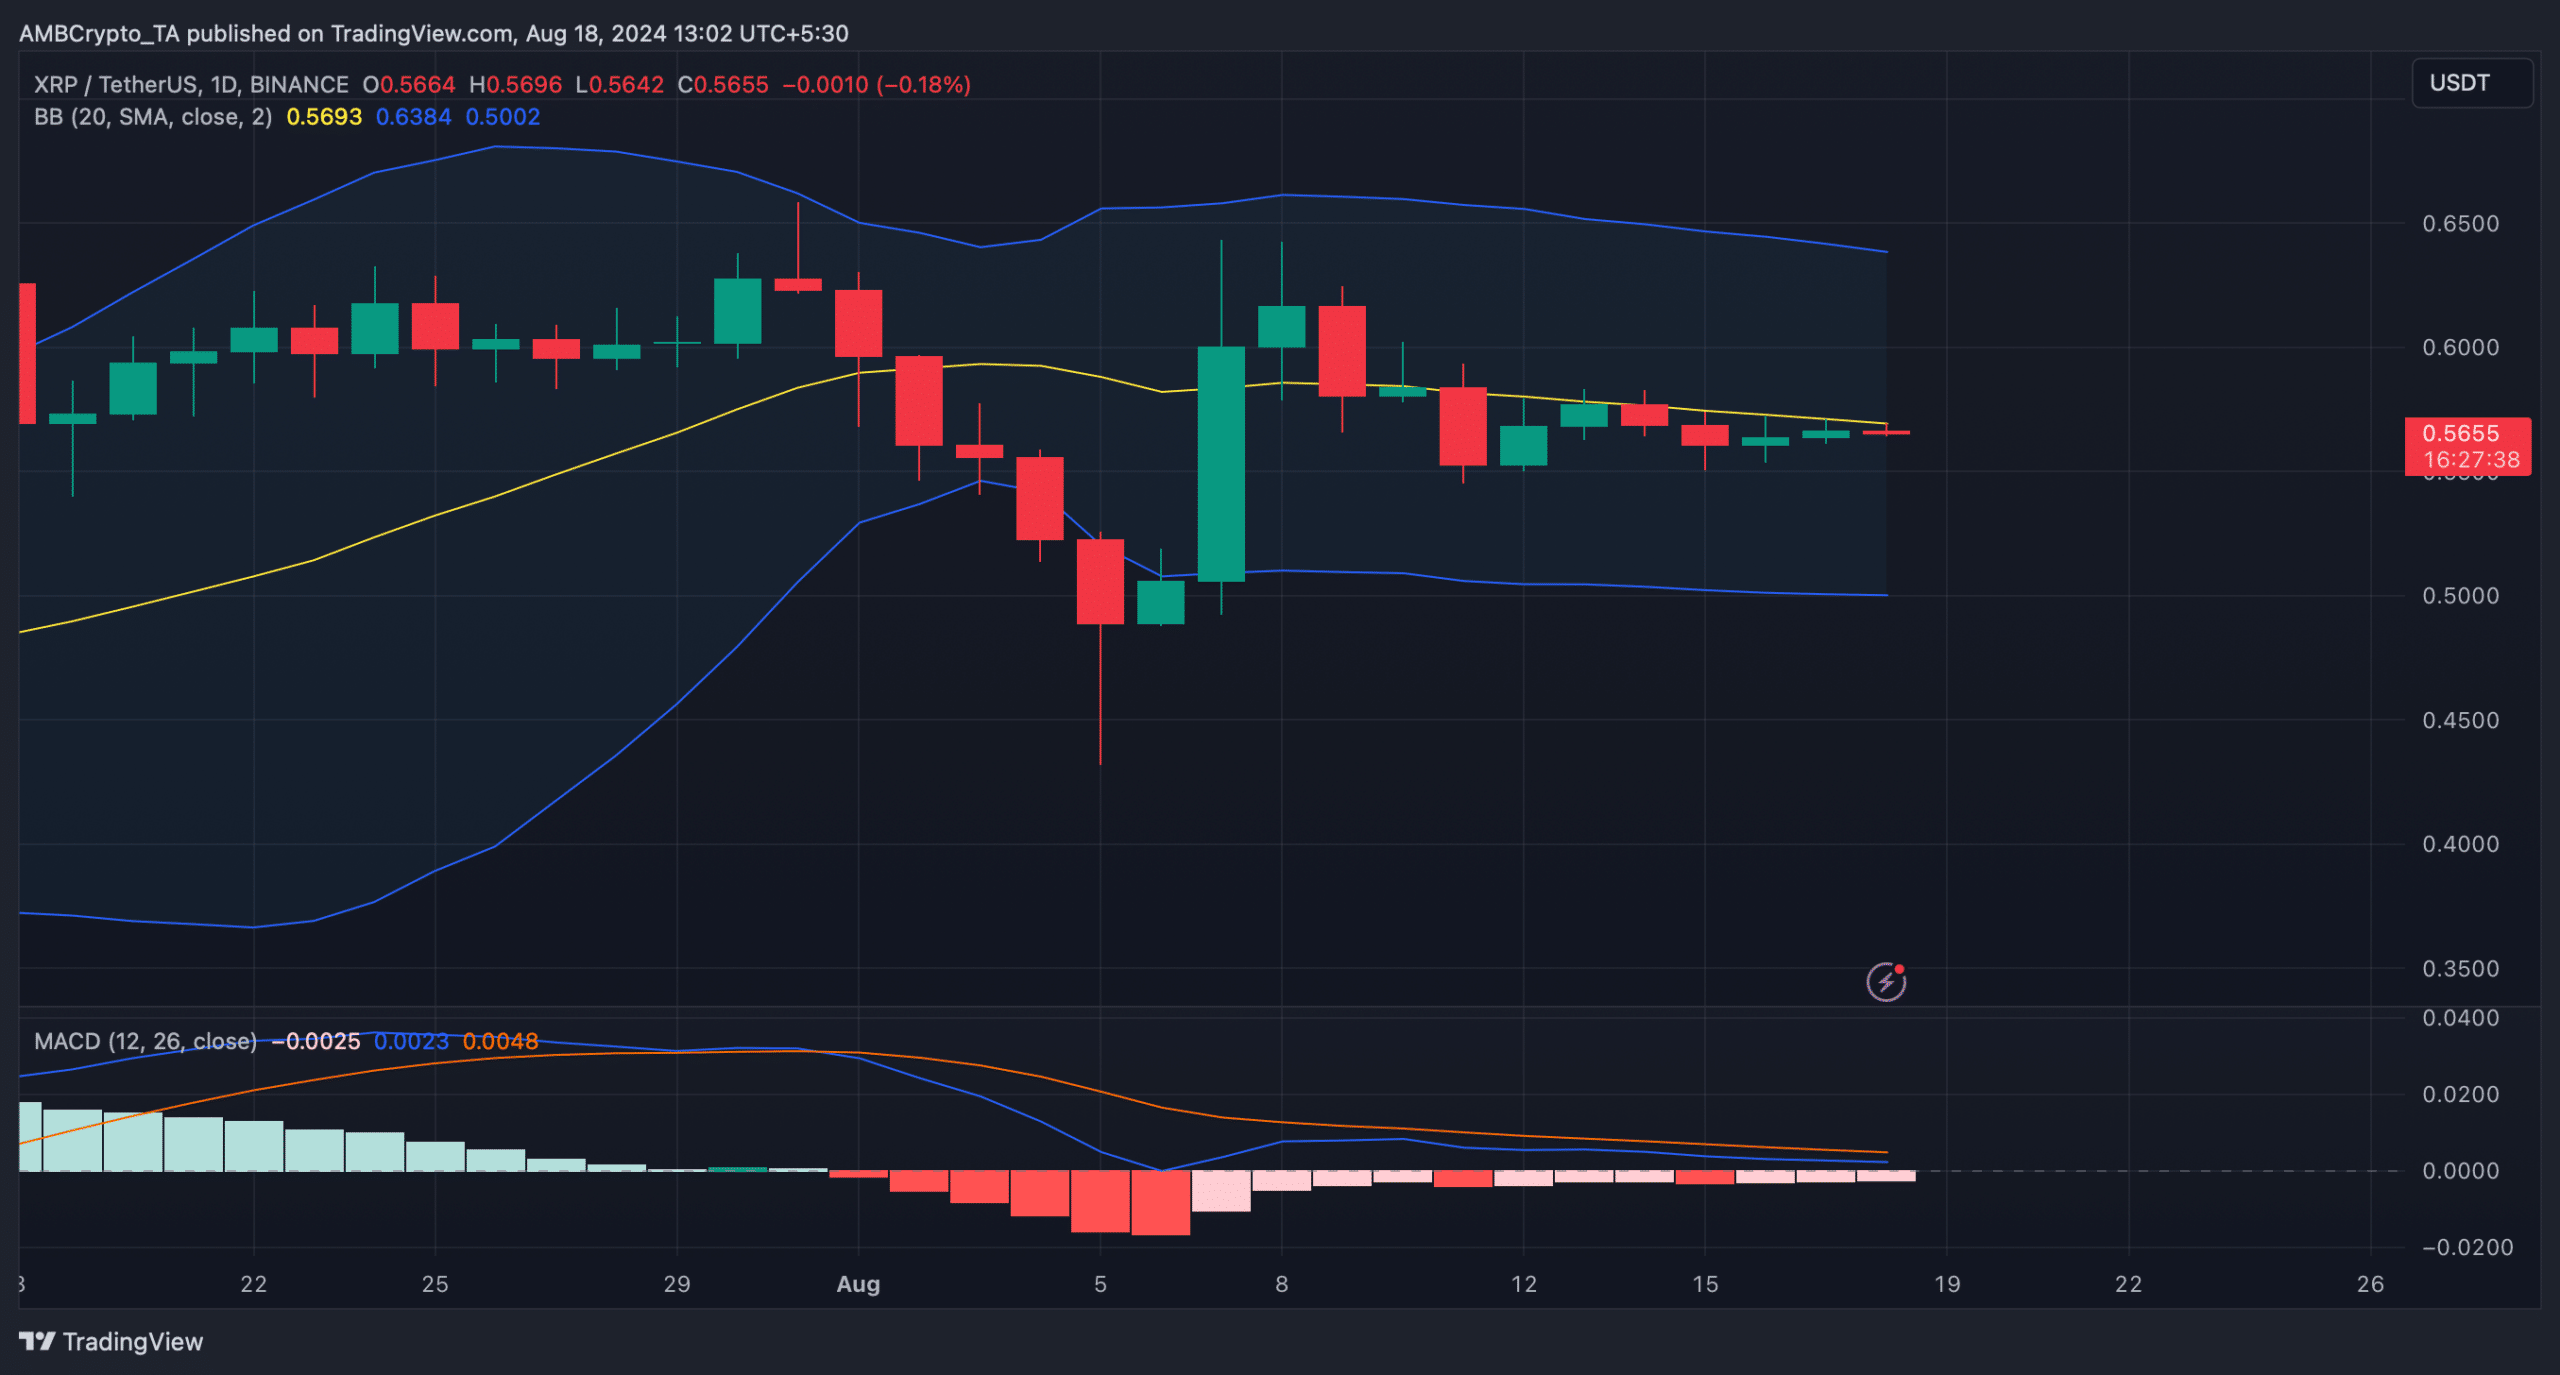
Source: TradingView
Mentioning short-term targets, if the bearish trend continues, then the token might first drop to $0.55. However, in case of a bullish trend reversal, XRP might reach $0.59 in the coming days.

Source: Hyblock Capital