XRP, Axie Infinity, SushiSwap Price Analysis: 14 April

XRP has seen a low timeframe shift in momentum toward the bullish side, but the market structure remained bearish for XRP and some altcoins. The bounce in the price of Bitcoin the previous day spurred many tokens in the altcoin market to post some gains in recent hours. However, Axie Infinity and SushiSwap still had strong resistance to the north.
XRP
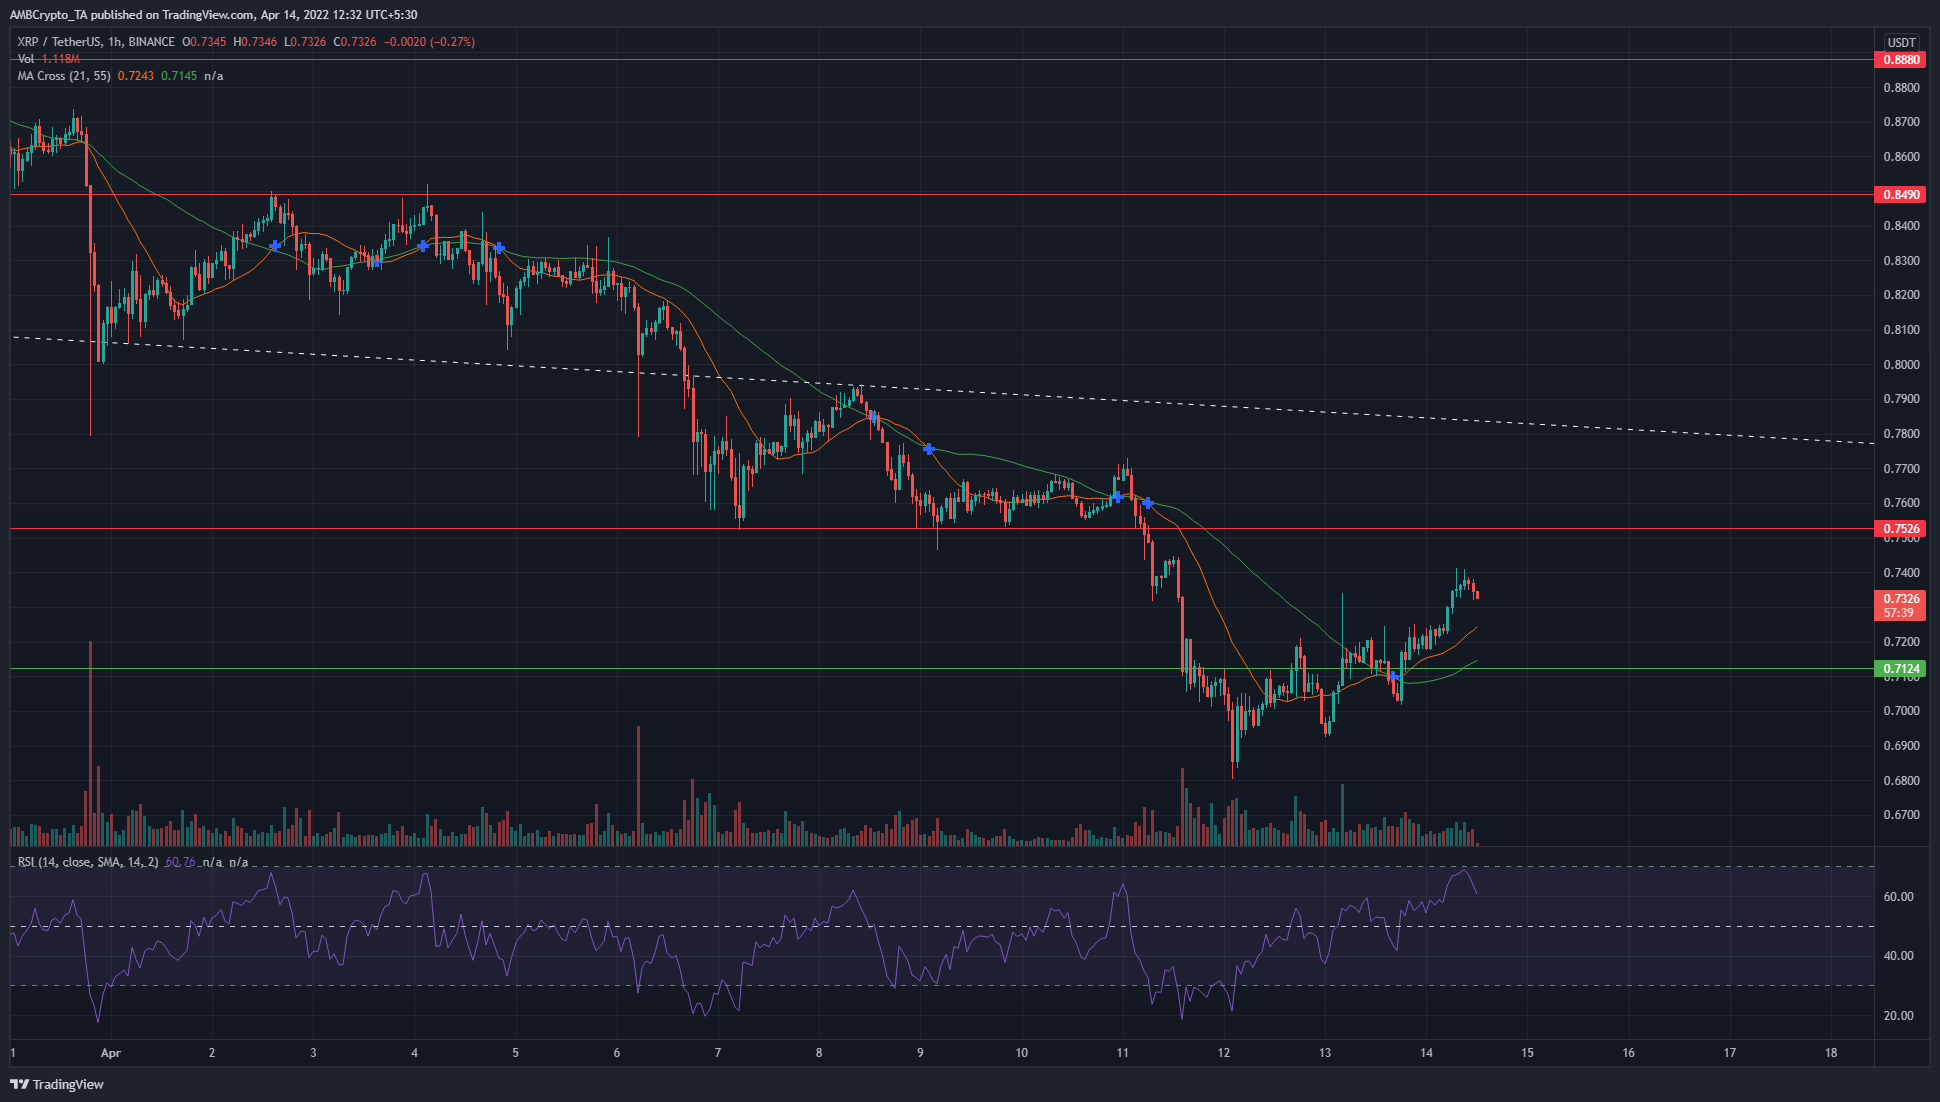
On longer timeframes, the dotted white line is an important level that XRP has ceded to the bears in the past week. At the time of writing, XRP faced strong resistance at $0.75. Even though it has posted some recovery from the $0.69 lows, the market structure was not bullish.
The 21 SMA made a bullish crossover above the 55-period moving average on the hourly chart, which was a reflection of the upward momentum of the past couple of days. The RSI also climbed above neutral 50.
On the other hand, the $0.74-$0.76 area could offer stiff resistance to further advances from the bulls.
Axie Infinity (AXS)
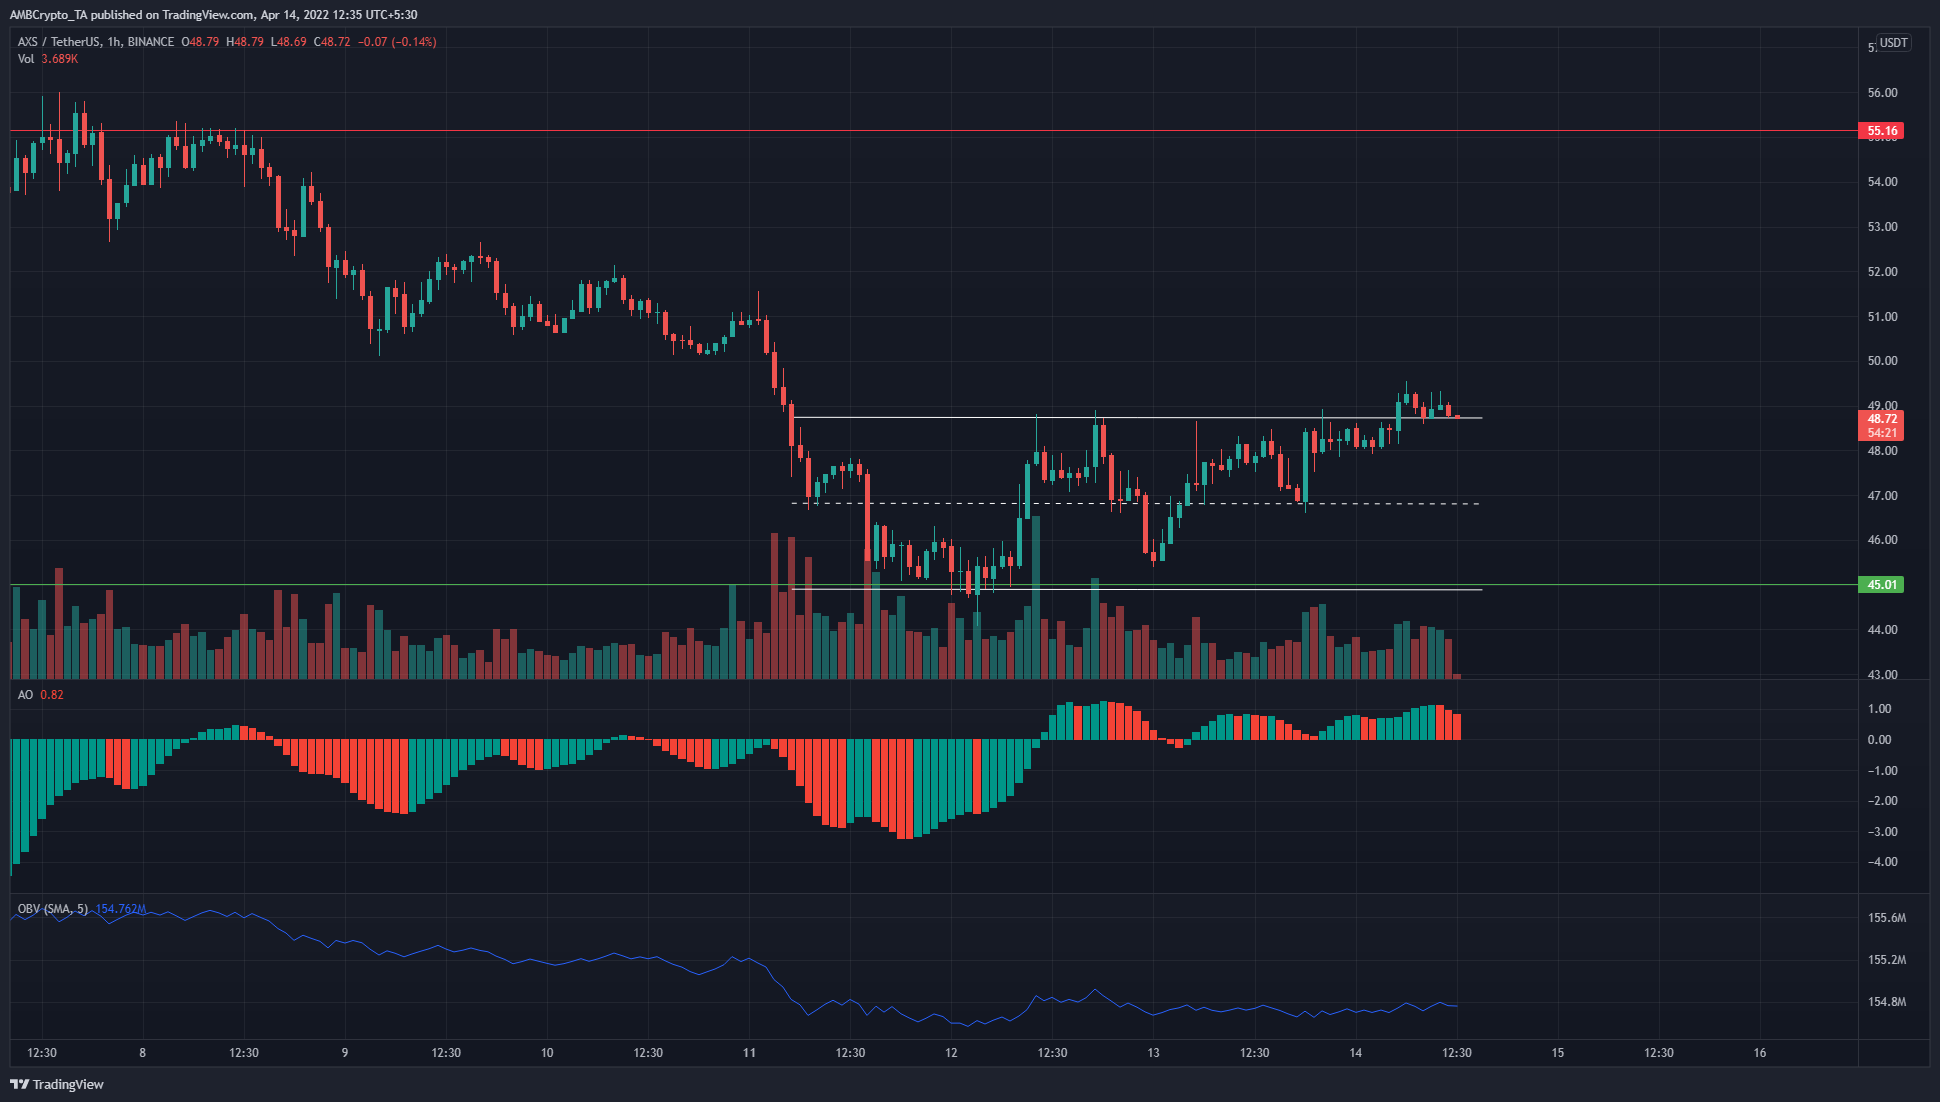
AXS had been trading within a range (white) and was just above the range highs at press time. However, this was likely not representative of a breakout. Selling or shorting opportunities could be imminent.
The price does sometimes exceed the bounds of a range in search of liquidity, before reversing to the opposite side of the range. To corroborate, the OBV was moving sideways. In a true breakout, the OBV would likely have seen a much greater uptick.
SushiSwap (SUSHI)
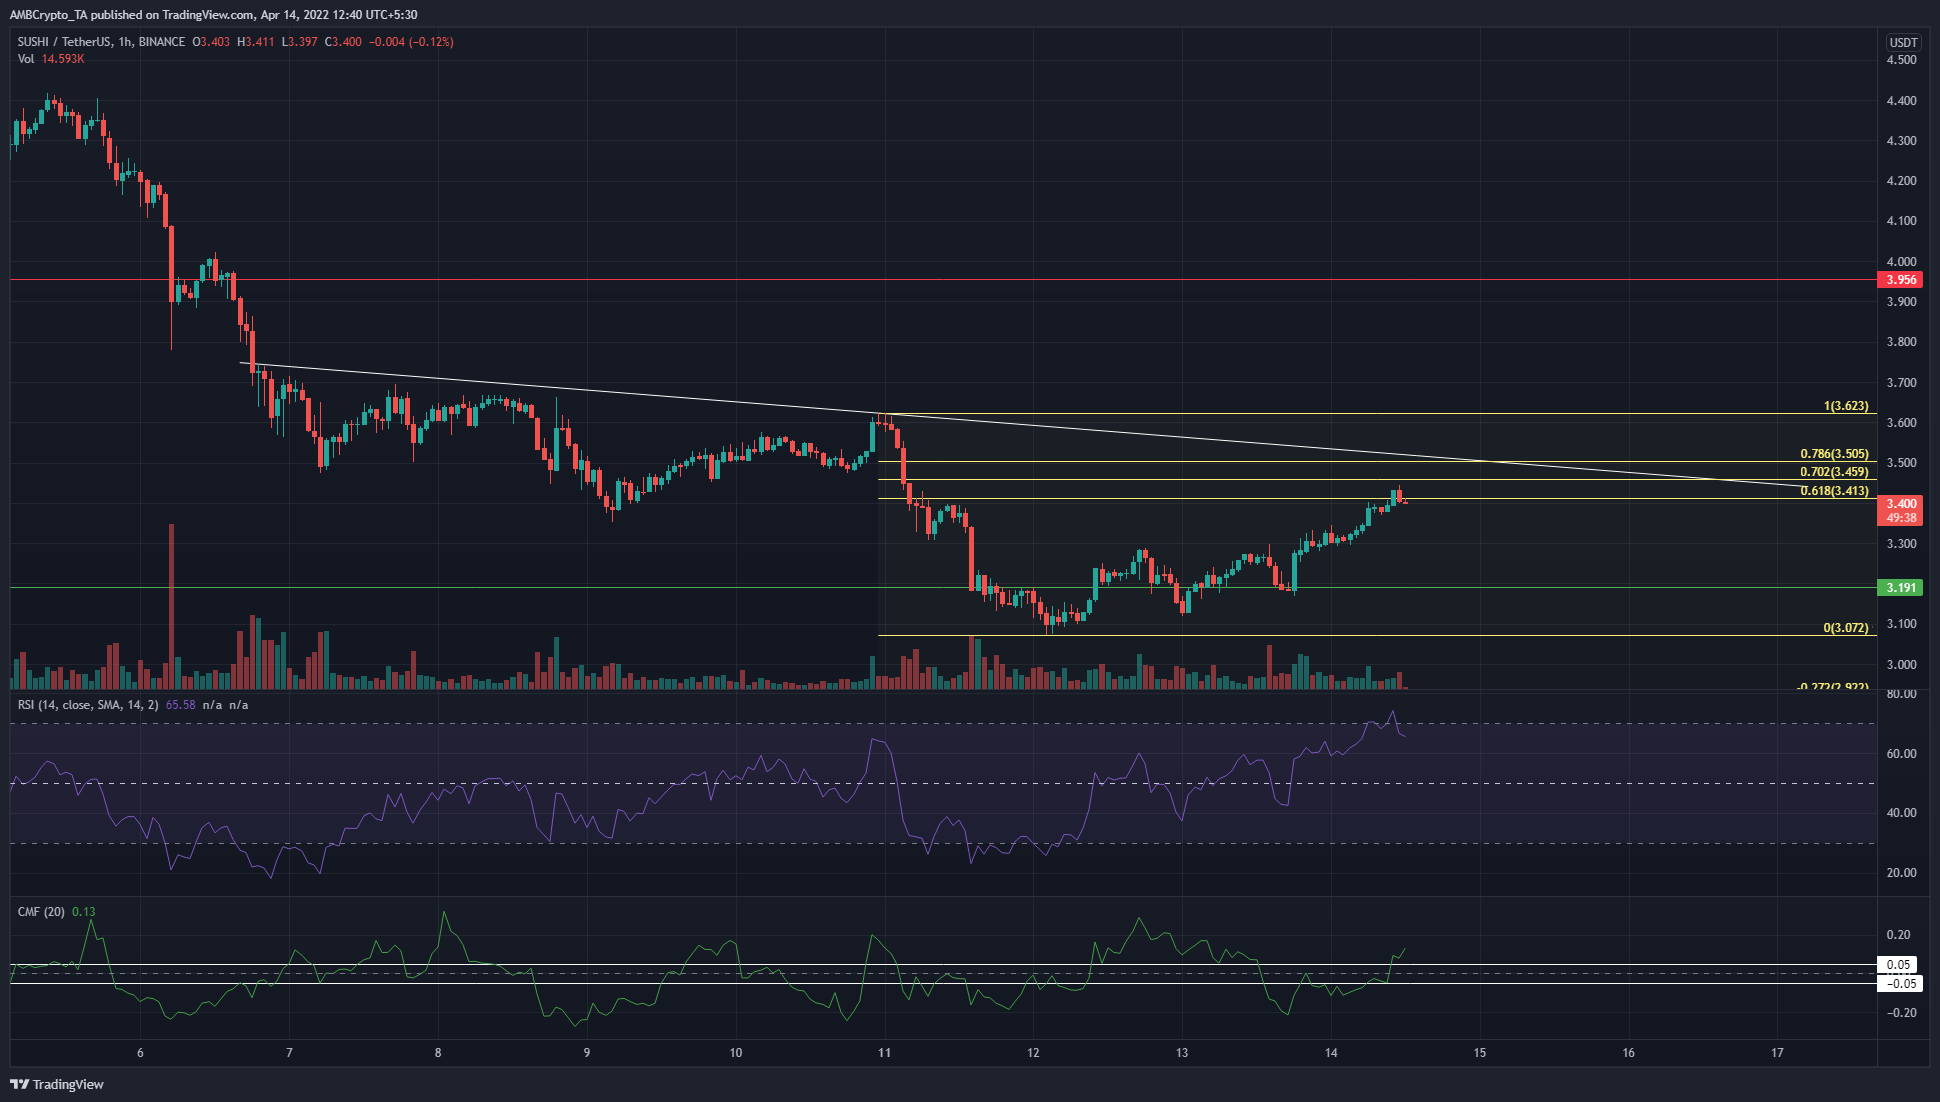
In the past week, the descending trendline resistance (white) was an important level for the bulls to beat. Based on the move to the downside from $3.62 to $3.07, the $3.41-$3.5 area represents a place where the previous downtrend could resume once more.
The trendline resistance, along with the Fibonacci levels, is a confluence of resistance that the bulls are likely to struggle to overcome.
In contrast to this bearish outlook, the RSI stood at 65 to show strong bullish momentum. The CMF was also above the +0.05 to show significant buying pressure, both of which indicate a move to the upside.