XRP, Binance Coin, Cosmos Price Analysis: 02 February

With Bitcoin moving above its 4-hour 20 and 50 SMA, XRP managed to poke above all its EMA ribbons. But it still had to fight its long-term bearish tendencies to sustain this level.
On the other hand, Binance Coin saw an improving RSI but failed to ramp up its volumes. Further, Cosmos flashed mixed signals after breaking out of its descending channel.
XRP
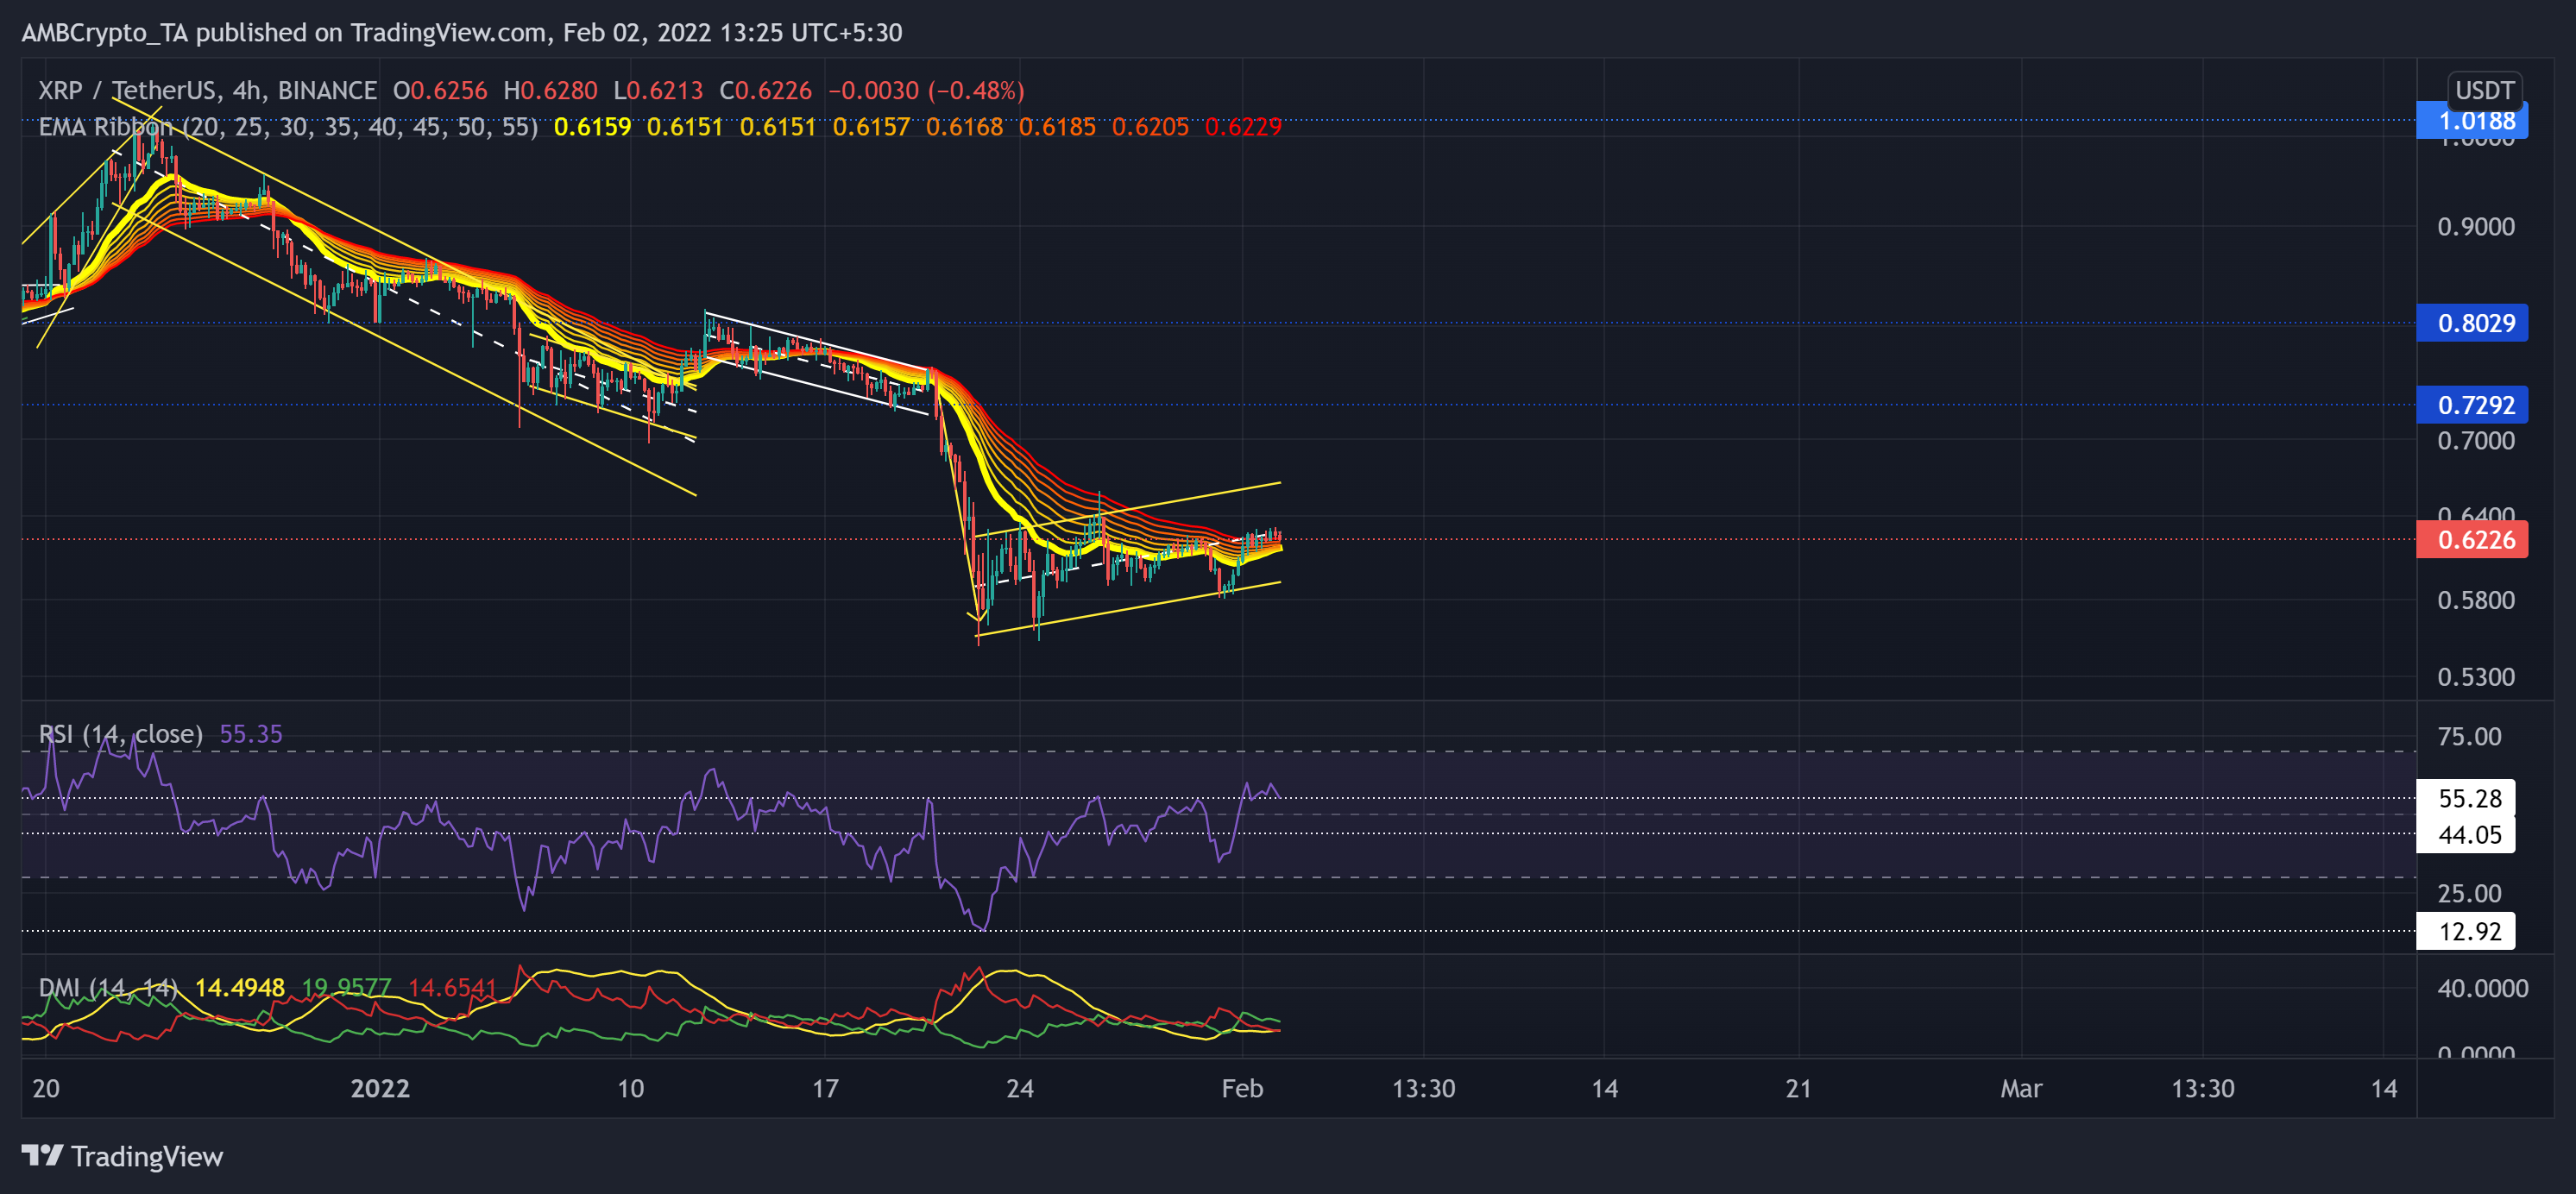
Since losing the $1.01-level on 26 November, the alt has been on a steady descent. Post that, the bears tested the $0.7292-mark multiple until the 21 January sell-off.
After breaking out of the previous down-channel (white), XRP plunged by 32.6% (from 12 January) to touch its six-month low on 22 January. With a 9.2% revival in the past two days, XRP moved above all its EMA Ribbons. But it reversed from the half-line of the up-channel (yellow). Any retracement would find a floor at the lower trendline of the channel.
At press time, XRP traded at $0.6226. After hitting its 13-month low, the RSI steadily marked higher troughs and tested the 55-mark multiple times. It finally breached this mark flipped it to immediate support. Although the DMI affirmed a bullish momentum, the ADX flashed a weak directional trend for the alt.
Binance Coin (BNB)
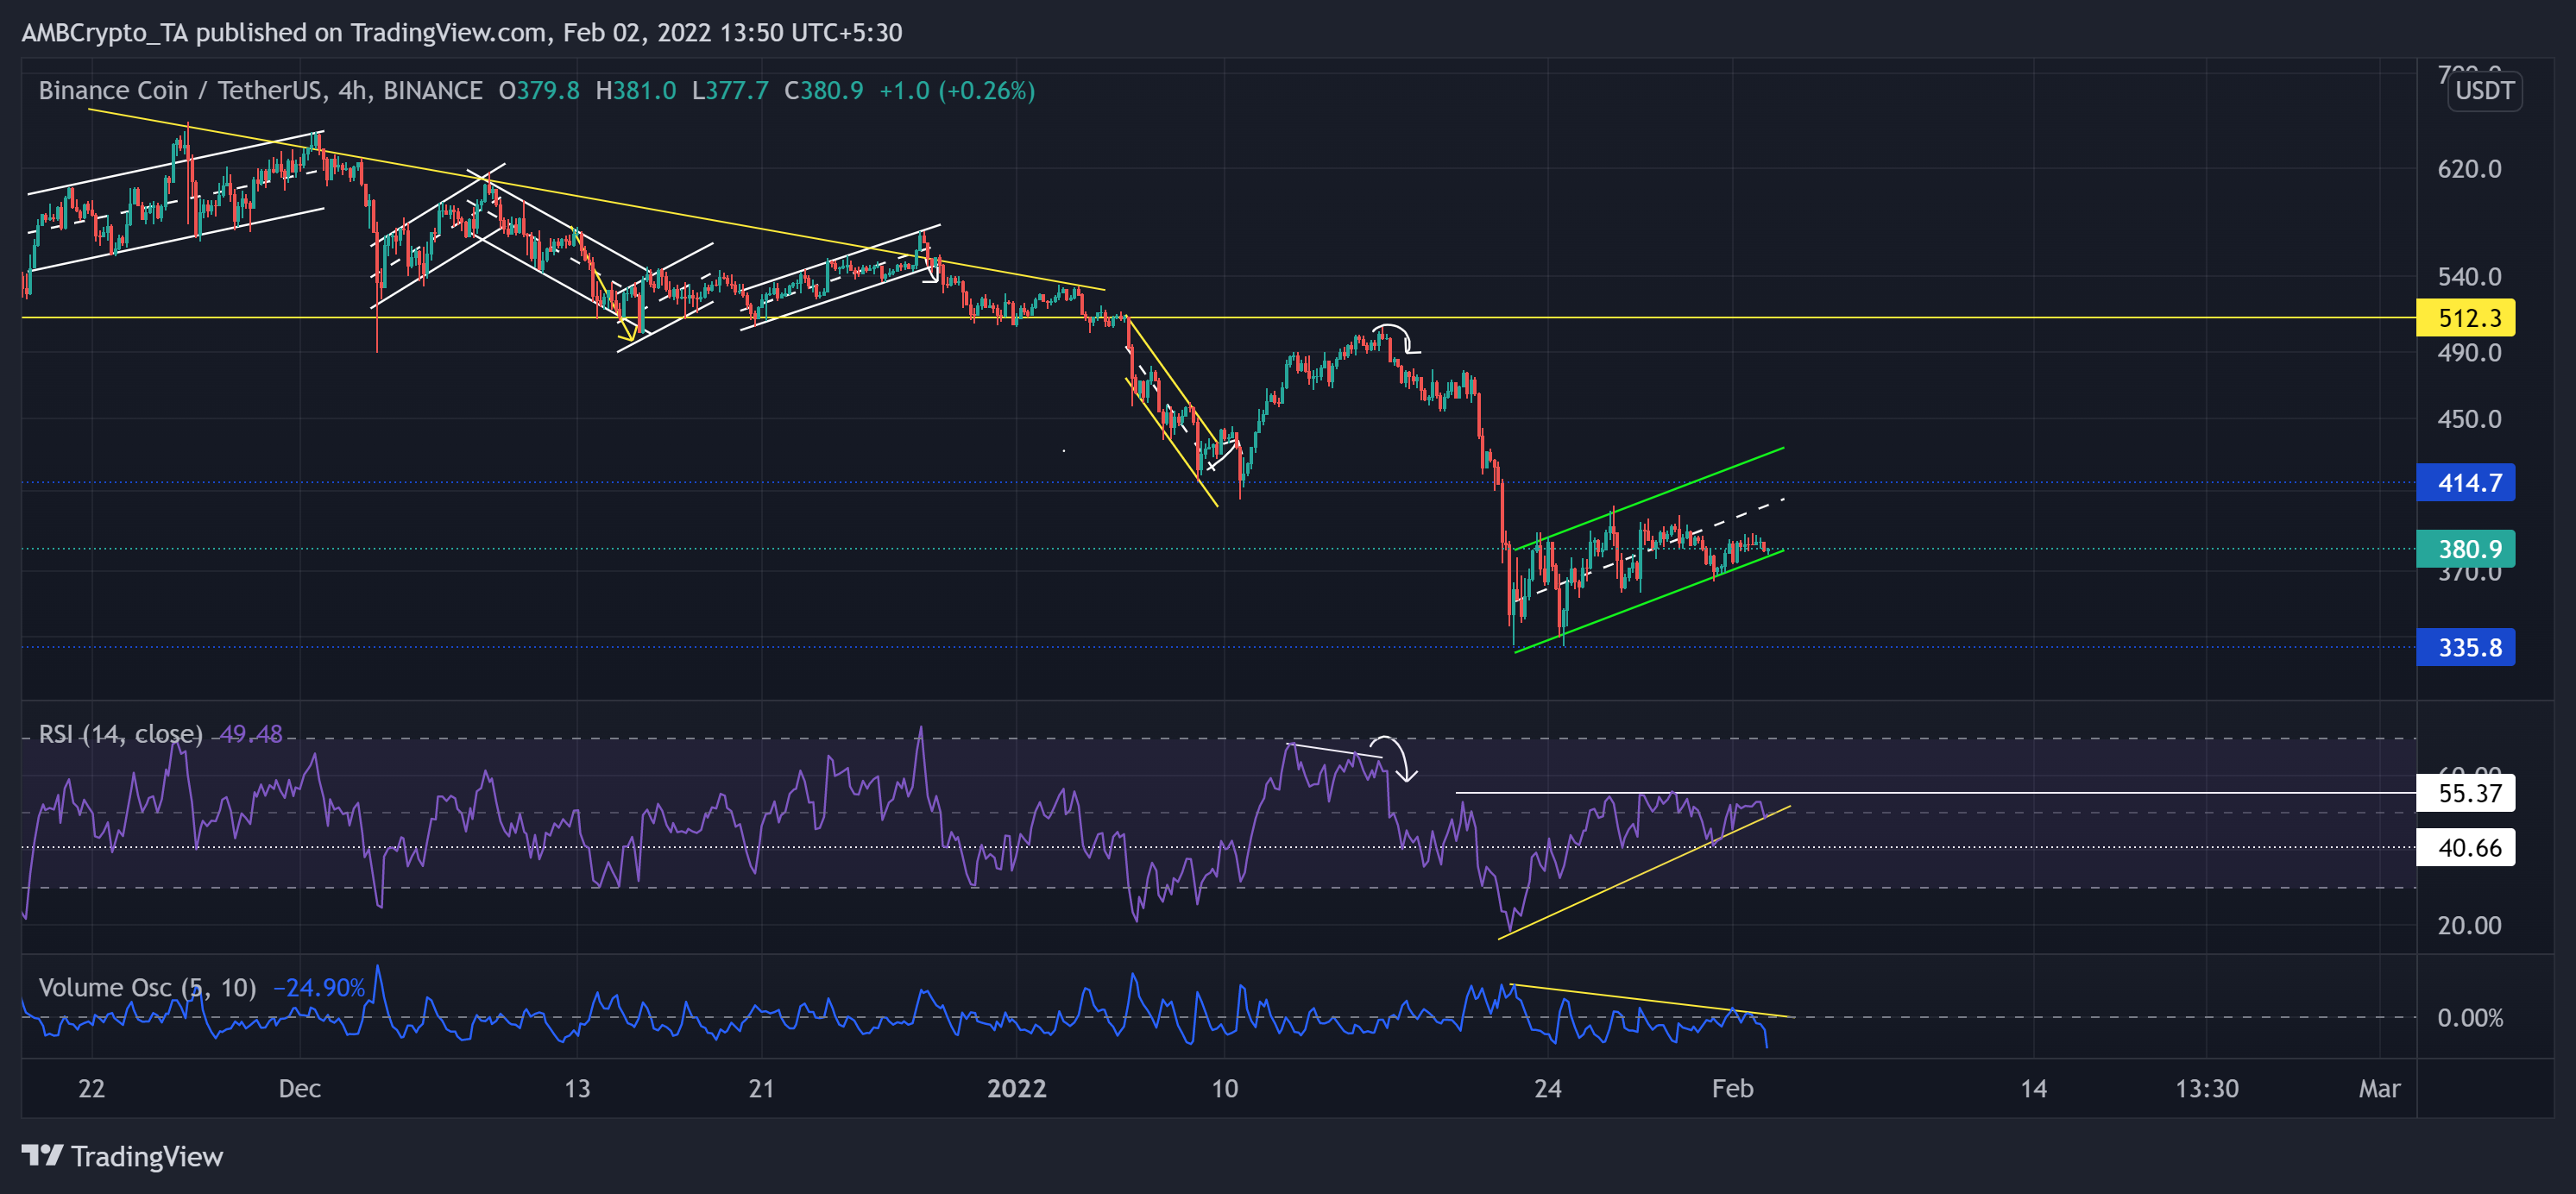
After breaking down from its long-term descending triangle, it witnessed two substantial sell-offs. As a result, BNB noted a 34.78% loss (from 5 January) and touched its 16-week low on 24 January.
Eventually, the bears flipped the three-month support at the $414-mark to resistance. Over the past few days, the alt formed a bearish flag on its 4-hour chart. Now, the immediate resistance for the bulls would be at the equilibrium (white, dashed line) of the up-channel (green).
At press time, the BNB was trading at $380.9. The RSI saw an impressive recovery in the last ten days. It revived by over 30 points and marked higher troughs. But it still needed to cross 55-mark resistance to confirm the bullish momentum. Meanwhile, the Volume Oscillator saw lower peaks, hinting at a weak bullish motion.
Cosmos (ATOM)
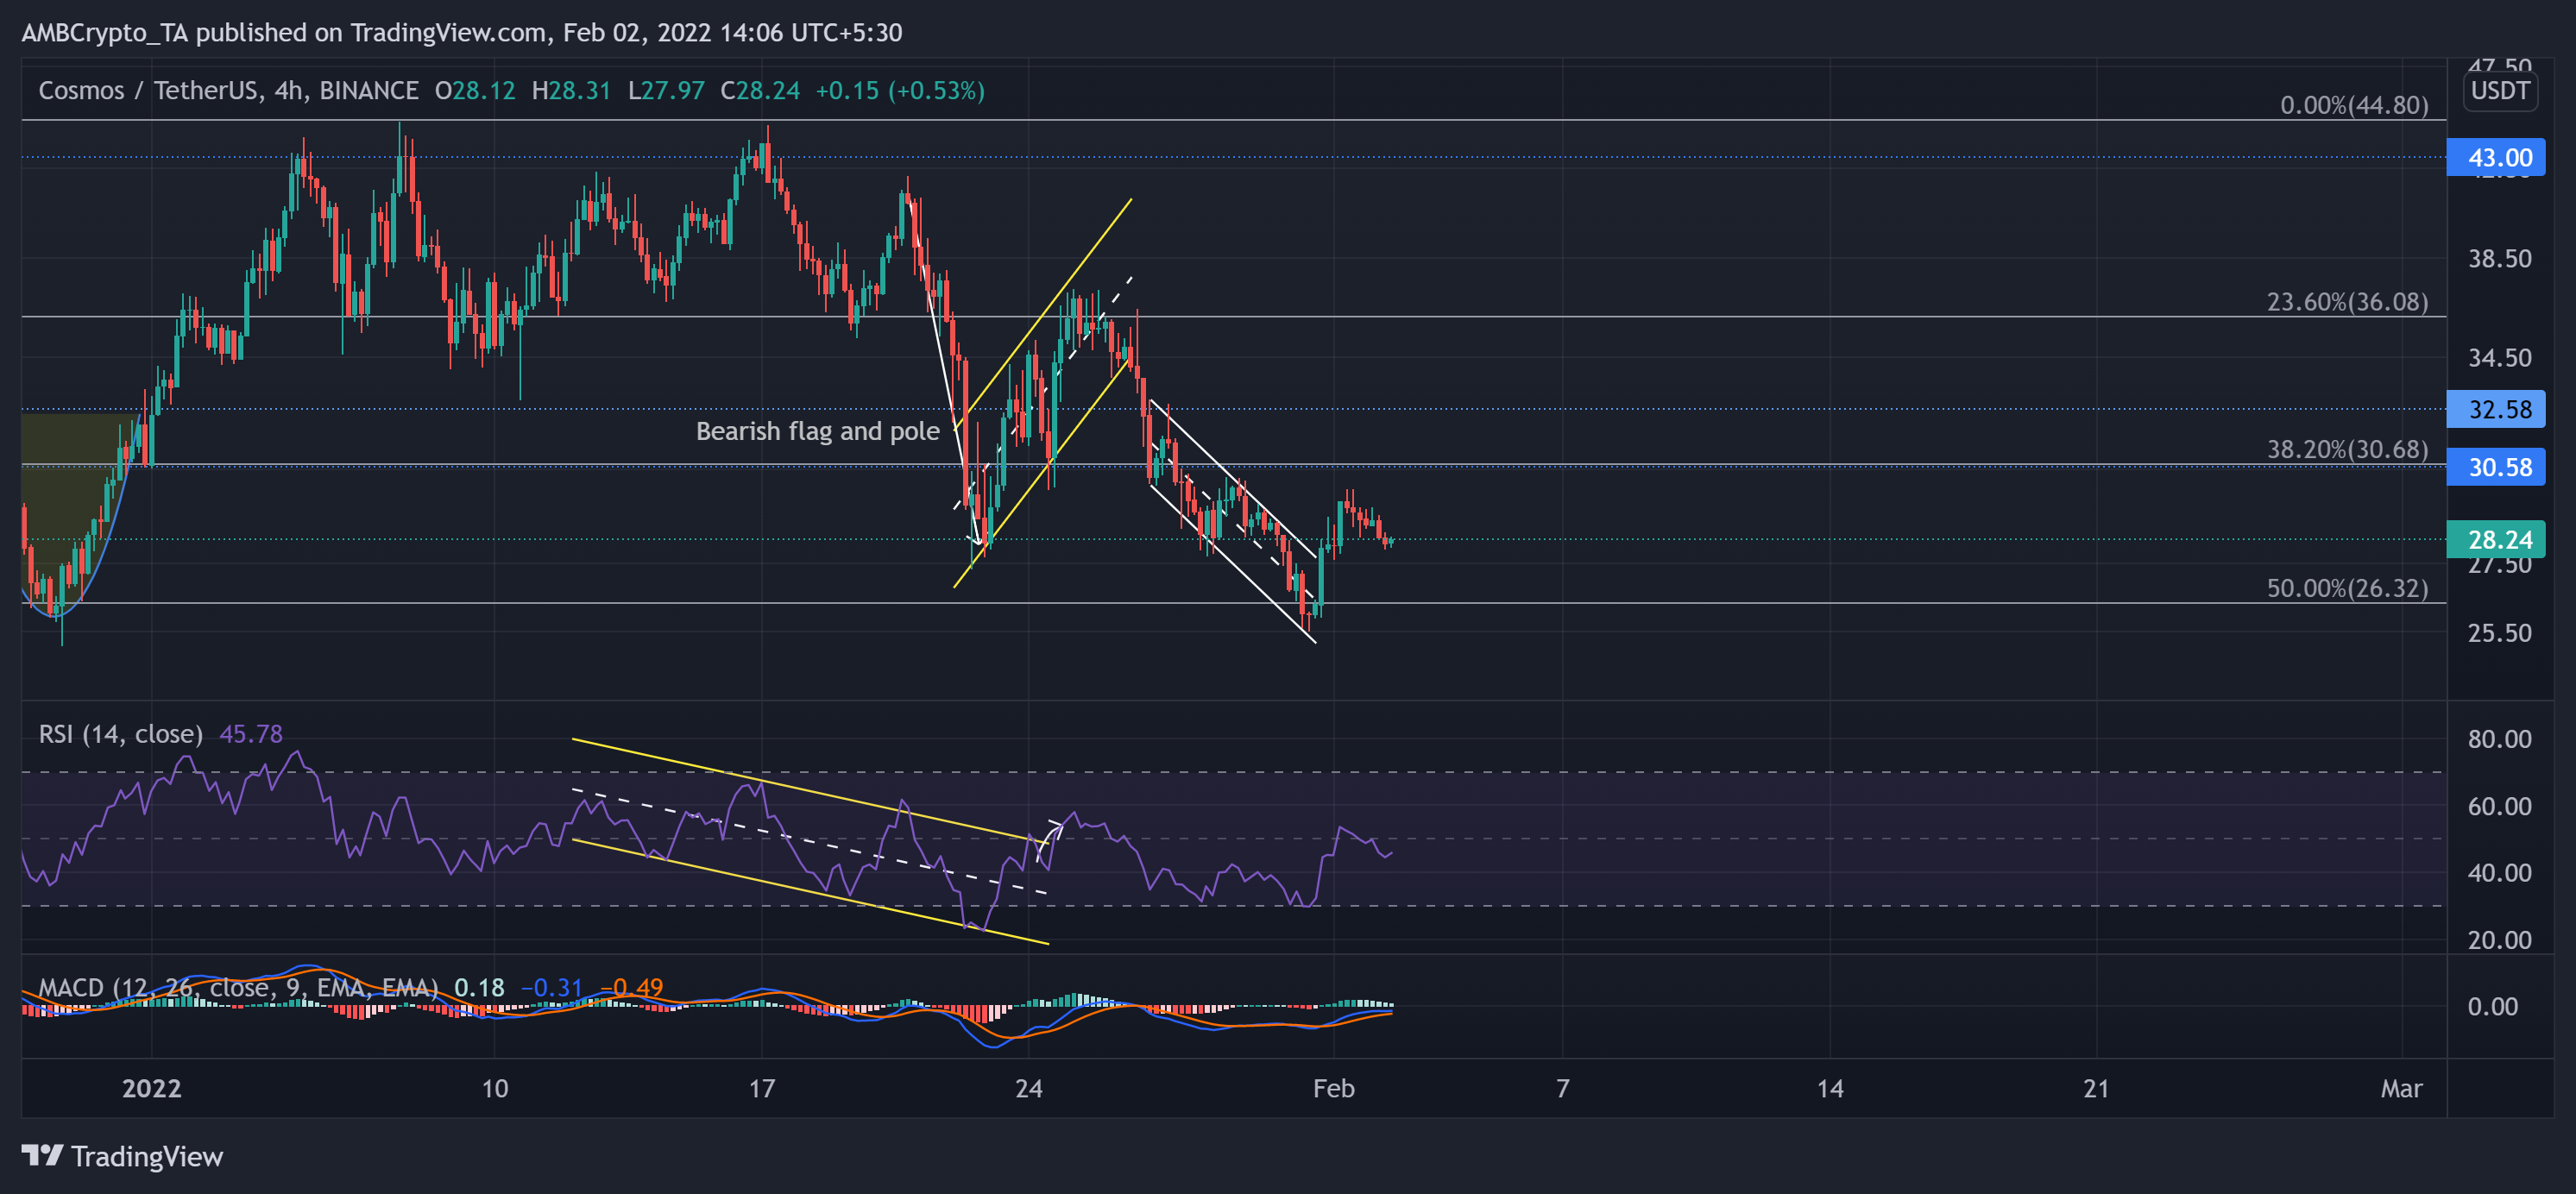
The sellers ensured the $43-mark resistance and kept countering the bullish influence since 17 January. The recent sell-off led ATOM to lose 29.85% (from 26 January) of its value until 31 January.
ATOM saw an expected breakdown after forming a bearish flag and pole pattern. It steeply dropped to lose support at the 38.2% Fibonacci level. Now, the immediate testing grounds for the bears stood at the $26-mark. Besides, bullish comebacks would find a ceiling at the $30-level.
At press time, ATOM was trading at $28.24. Although the RSI saw a decent rise over the past two days, it needed to close above the midline to confirm the bullish edge. Further, the MACD histogram maintained itself above the zero-line. But its lines hinted at a bearish edge.