XRP bounces from mid-range support level – can bulls push toward $0.41

Disclaimer: The information presented does not constitute financial, investment, trading, or other types of advice and is solely the writer’s opinion.
- XRP had a bullish bias but was trading just beneath a resistance level.
- A move above $0.385 would signal a good chance of an upward continuation for the price.
Ripple’s [XRP] prices reached a long-term support level of $0.374 over the past few days. The sellers attempted to drive prices lower, but the bulls were able to fight back. At the time of writing, the lower timeframe momentum had flipped bullish.
How much are 1, 10, and 100 XRP worth today?
However, that does not mean XRP was ready to shoot upward to the range highs at $0.41. There was yet another level of significance just overhead where XRP was trading at press time. If it were flipped to support, lower timeframe traders can look to buy the asset.
Momentum appeared to be on the verge of flipping to the bullish side
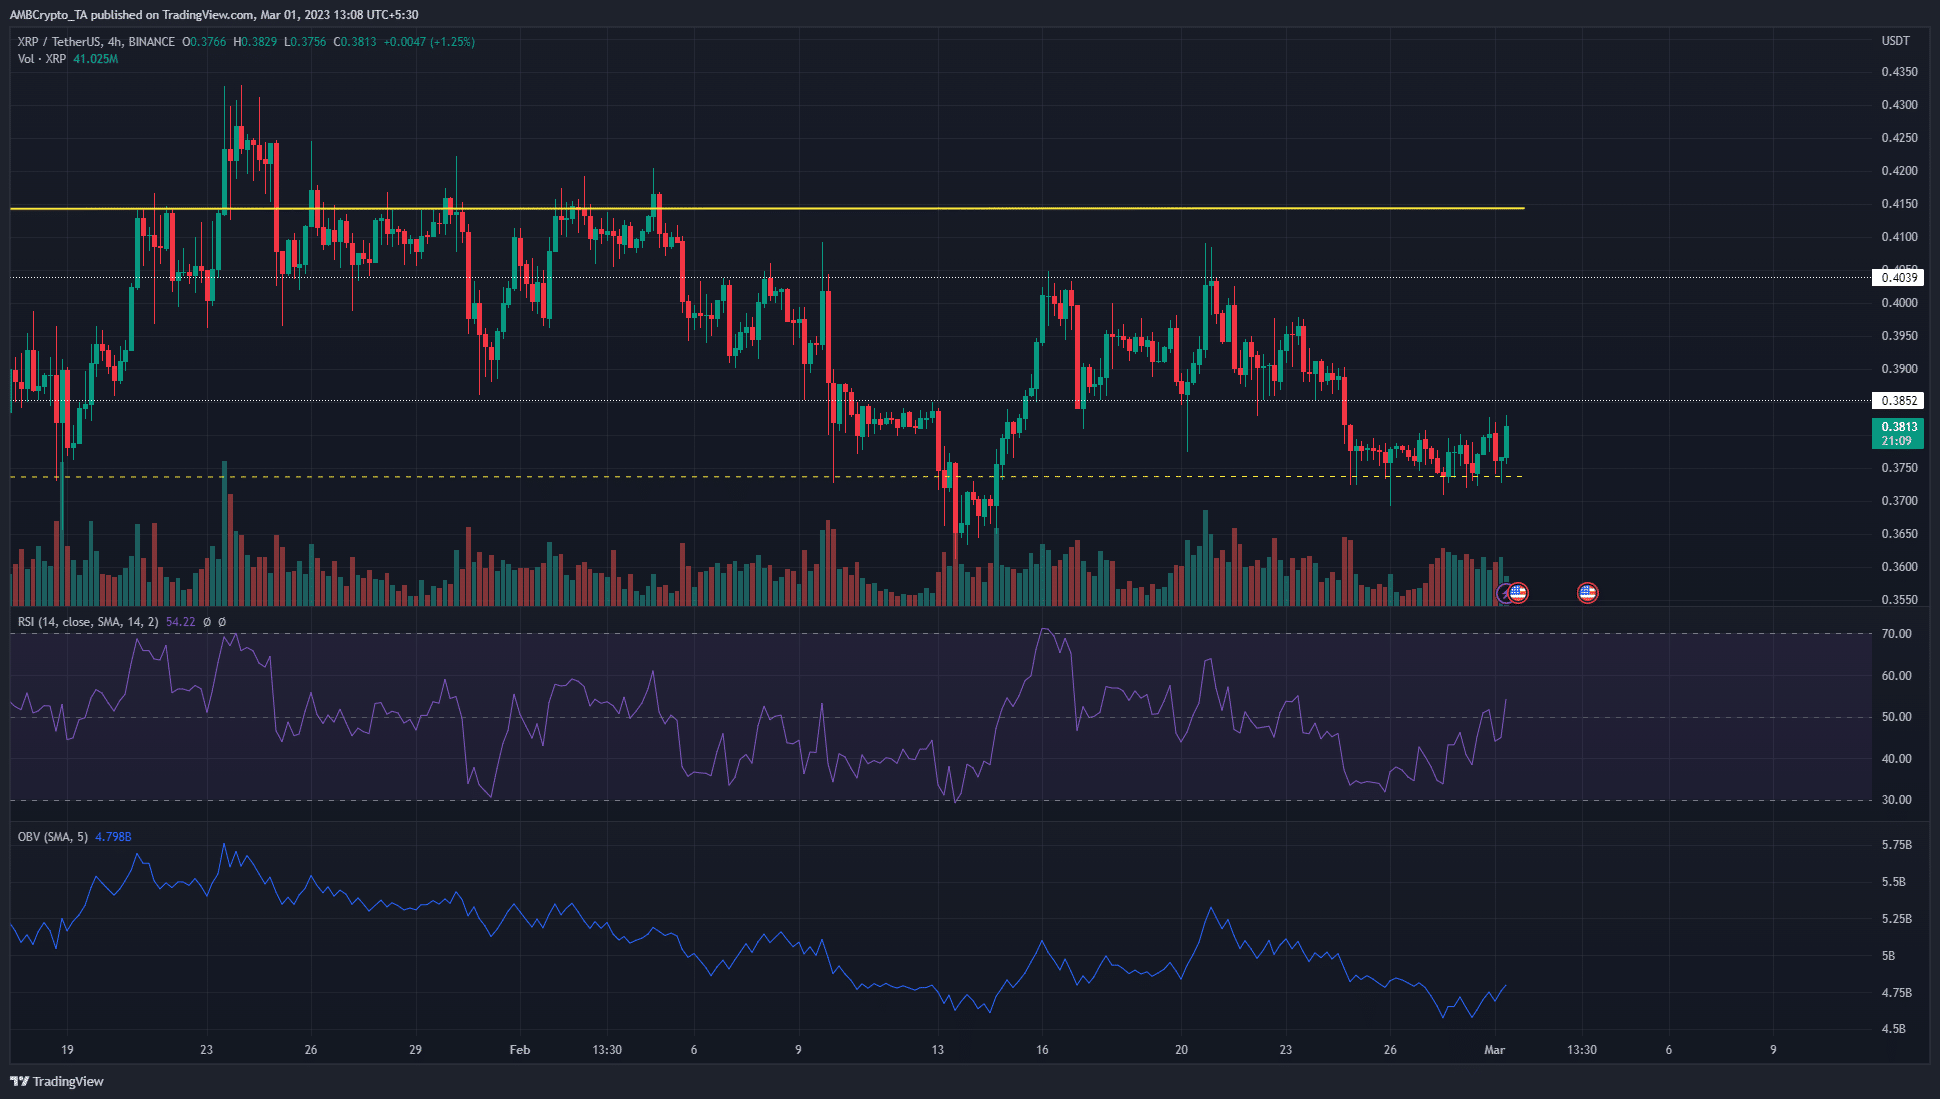
XRP has traded within a range from $0.415 to $0.33 since November, with the mid-range mark at $0.374. Before the late February retest of the $0.374 level, XRP had reached the same support level in mid-February. On that occasion, the bulls could not prevent a quick decline to the $0.36 mark. But thereafter, bullish sentiment had taken hold of the market. This was when Bitcoin [BTC] fell to the $21.6k support level.
At press time, Bitcoin traded at $23.7k. The next significant resistance level lies at $25.2k. It had already been rejected from this area on 20 February. Therefore, a deeper pullback to $22.5k can not be discounted.
This meant that although XRP displayed some bullishness, buying XRP could be risky. The RSI moved above neutral 50 and held a reading of 54, which indicated neutral to weak bullish momentum. On the other hand, the OBV has been in decline over the past two weeks.
Hence, despite the lower timeframe upward momentum, there was a lack of genuine demand from the buyers. This suggested that a rally could be short-lived. To the north, $0.385 and $0.405 are resistance levels to watch out for.
Realistic or not, here’s XRP’s market cap in BTC’s terms
The Open Interest declined despite advancing prices
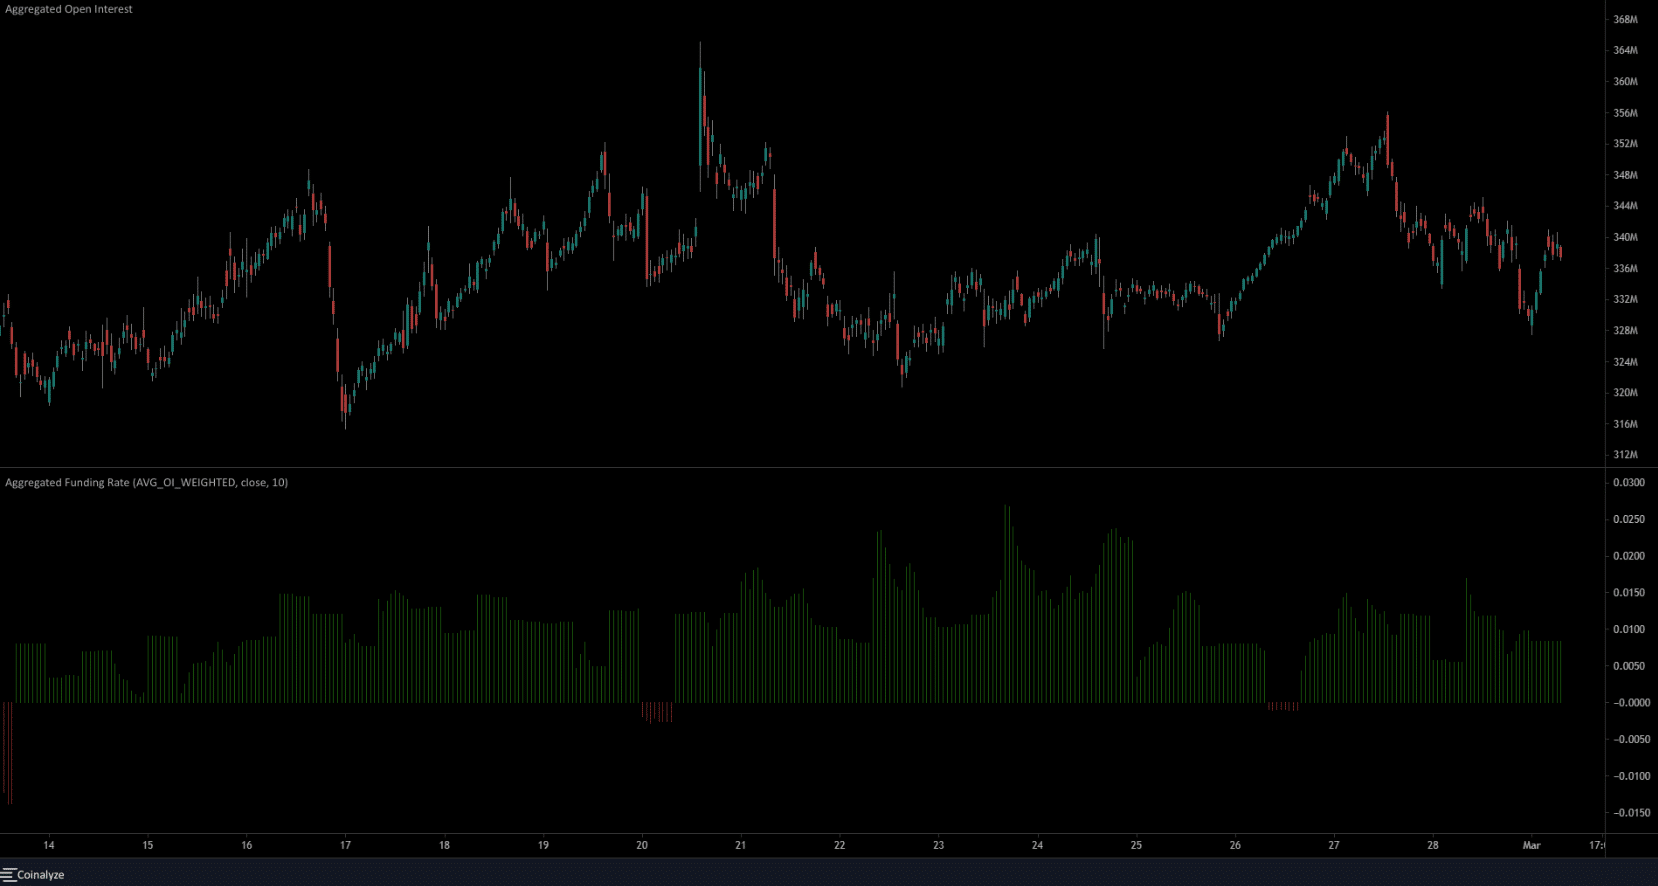
The one-hour chart on Coinalyze showed that the funding rate remained positive. But this was in contrast to the falling Open Interest over the past few hours, even though XRP rose higher. This suggested a lack of conviction in the futures market.
All put together, the indicators showed a lack of buying pressure despite the lower timeframe bullish outlook. On the four-hour chart, the bias was bullish after the strong bullish market structure break that occurred on 15 February, when prices shot above $0.385. This H4 bias would flip bearish if XRP dropped below $0.36.


