XRP bulls on alert! —Why $2.25 could signal a bearish reversal
Technical analysis showed that the higher timeframe trend for XRP was still bearish, and a short squeeze could occur over the next 24 hours.

- Traders should not FOMO into buying XRP after the break of the six-week trendline resistance.
- The possibility of a short squeeze meant that traders could look for opportunities to short XRP after a minor bounce.
Ripple [XRP] saw a breakout beyond the descending trendline resistance that has been in play since early March.
While this breakout, combined with flipping the psychological $2 level to support, was encouraging, it was not the end of the downtrend.
An earlier analysis underlined a build-up of liquidity around $1.95. A deeper price drop toward $1.2 was anticipated, but the liquidity overhead pulled prices higher. This trend is likely to continue in the short term.
Investors and traders can prepare to sell XRP at these levels
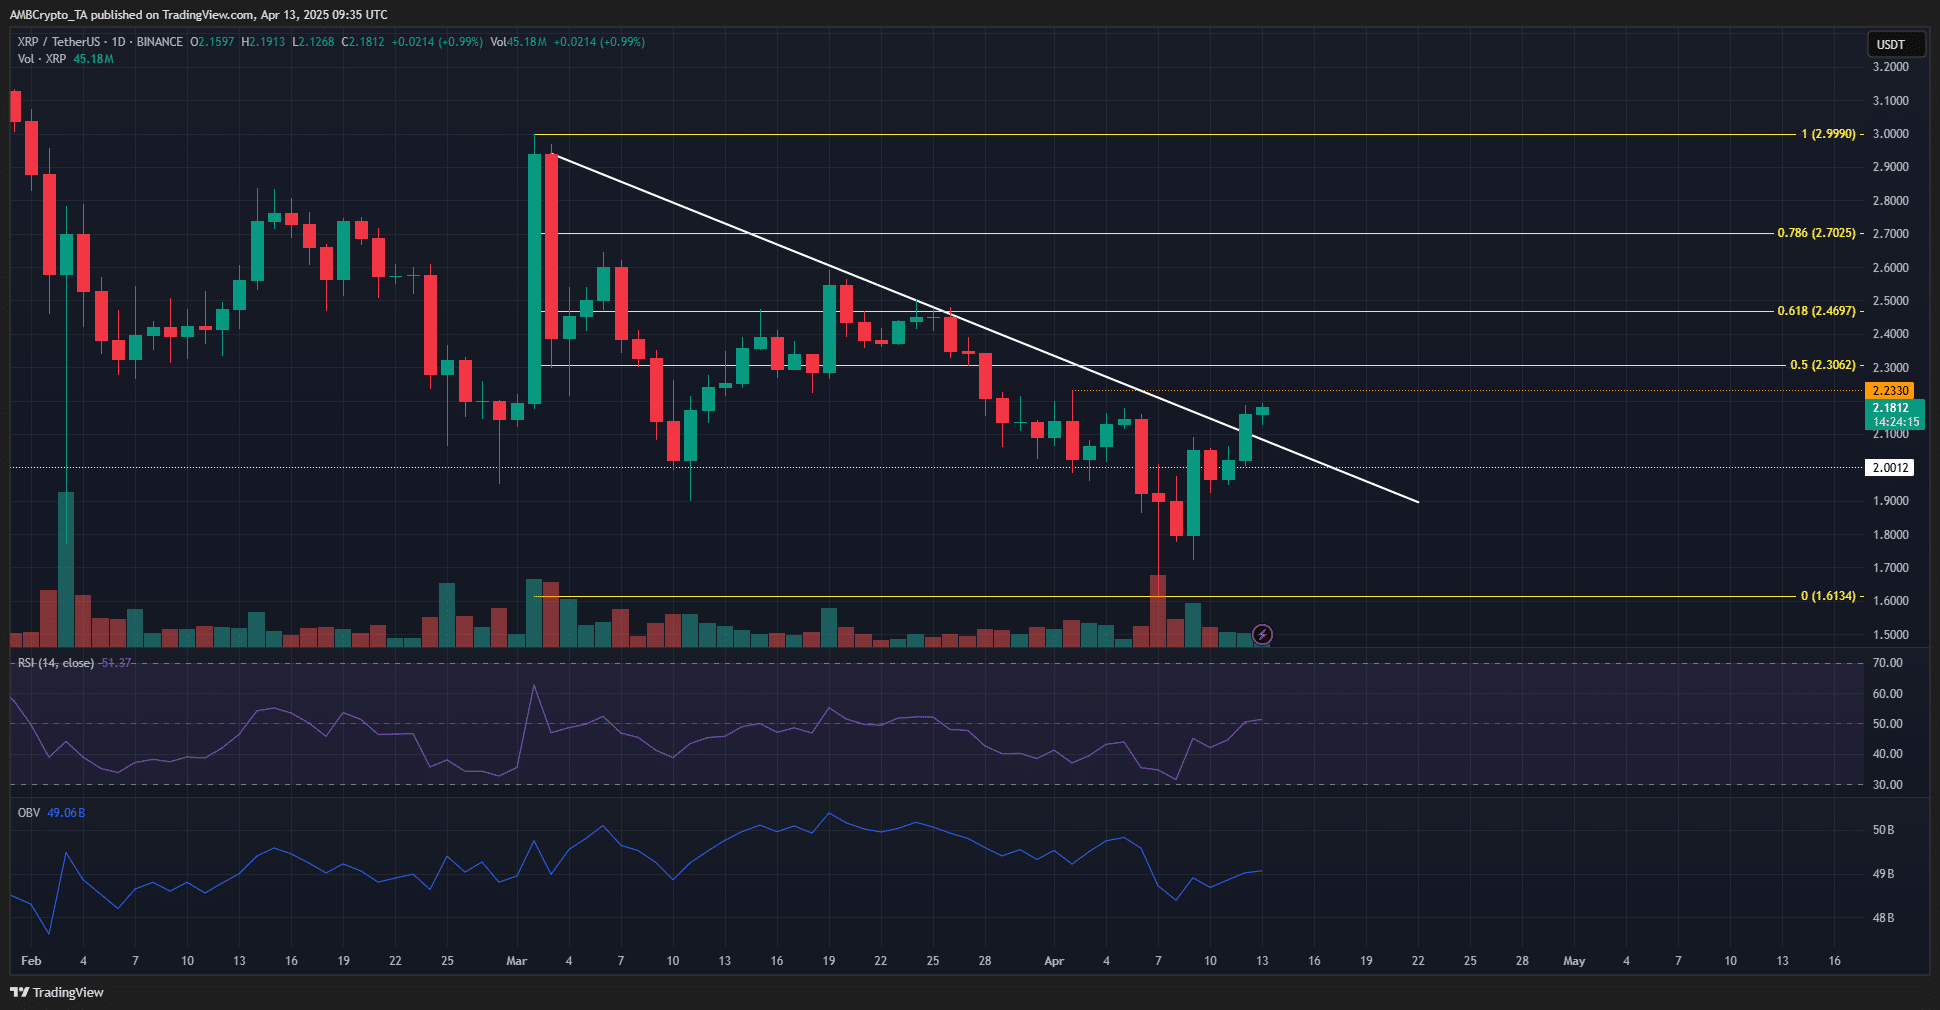
The price chart on the daily timeframe showed a bearish structure in play. The lower high at $2.23 was not yet breached, even though the trendline resistance was broken. Hence, the bearish outlook must be retained by traders.
The RSI was at 54, showing a bullish momentum shift. This was an early sign of a reversal, but it was overshadowed by the OBV’s finding. The volume indicator was in a downtrend alongside the price.
Until it can set a new higher high to signal steady demand, investors, and traders must be careful of taking bullish positions. The Fibonacci retracement levels showed that $2.46 and $2.7 were formidable resistance levels beyond the local resistance at $2.23.
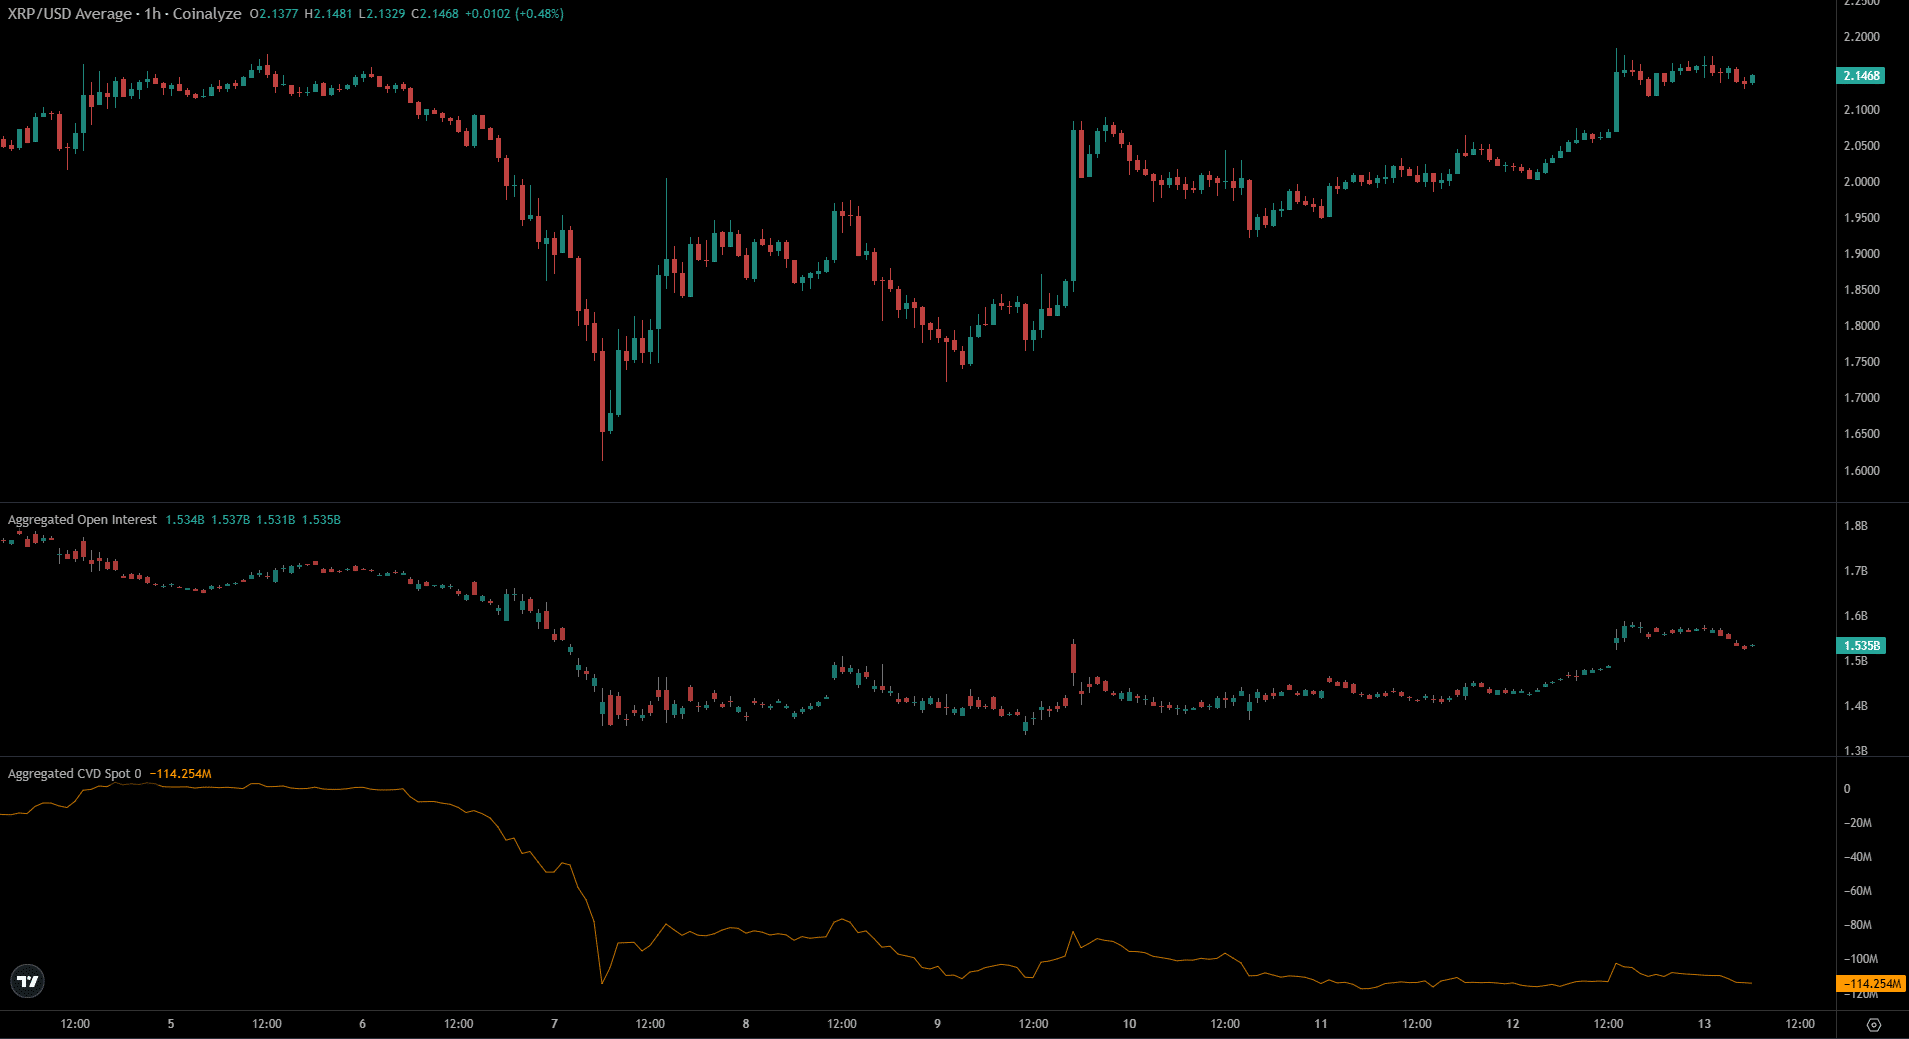
The Open Interest (OI) behind XRP has increased over the past 24 hours as the price rallied 6%, at press time. This increase in OI was not accompanied by a rise in spot CVD.
This indicated a lack of buying pressure in the spot markets. Therefore, it was more likely that the recent rally was driven by derivatives and could falter soon.
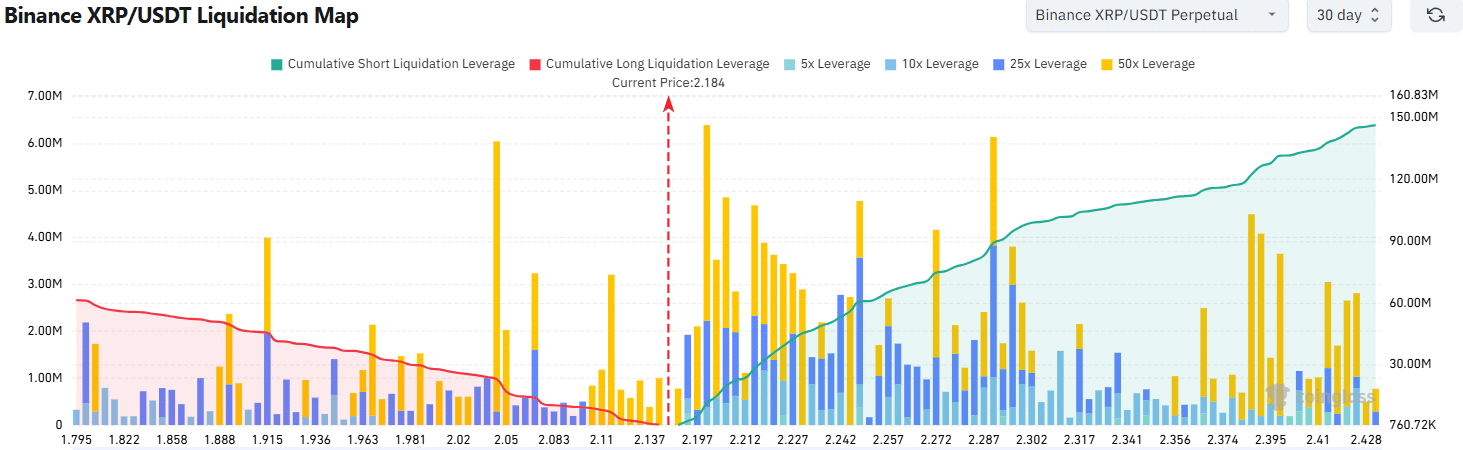
The liquidation heatmap reinforced this view. It showed a cluster of high-leverage liquidations just above the XRP market price, stretching to $2.25.
The increased cumulative leverage overhead meant that short sellers could get hunted in the short term before a bear reversal.
This short squeeze could yield a short-term bounce and also give traders a chance to go short.
Disclaimer: The information presented does not constitute financial, investment, trading, or other types of advice and is solely the writer’s opinion