XRP, Chainlink, Enjin Coin Price Analysis: 07 February

After the Crypto fear and greed index saw an 8 point surge in the last 24 hours, XRP broke above its up-channel to invalidate the bearish tendencies. Further, Chainlink reclaimed the $17.7-level while its Supertrend favored the buyers. Also, Enjin Coin displayed a bullish vigor but faced a hurdle at the $2.08-mark.
XRP
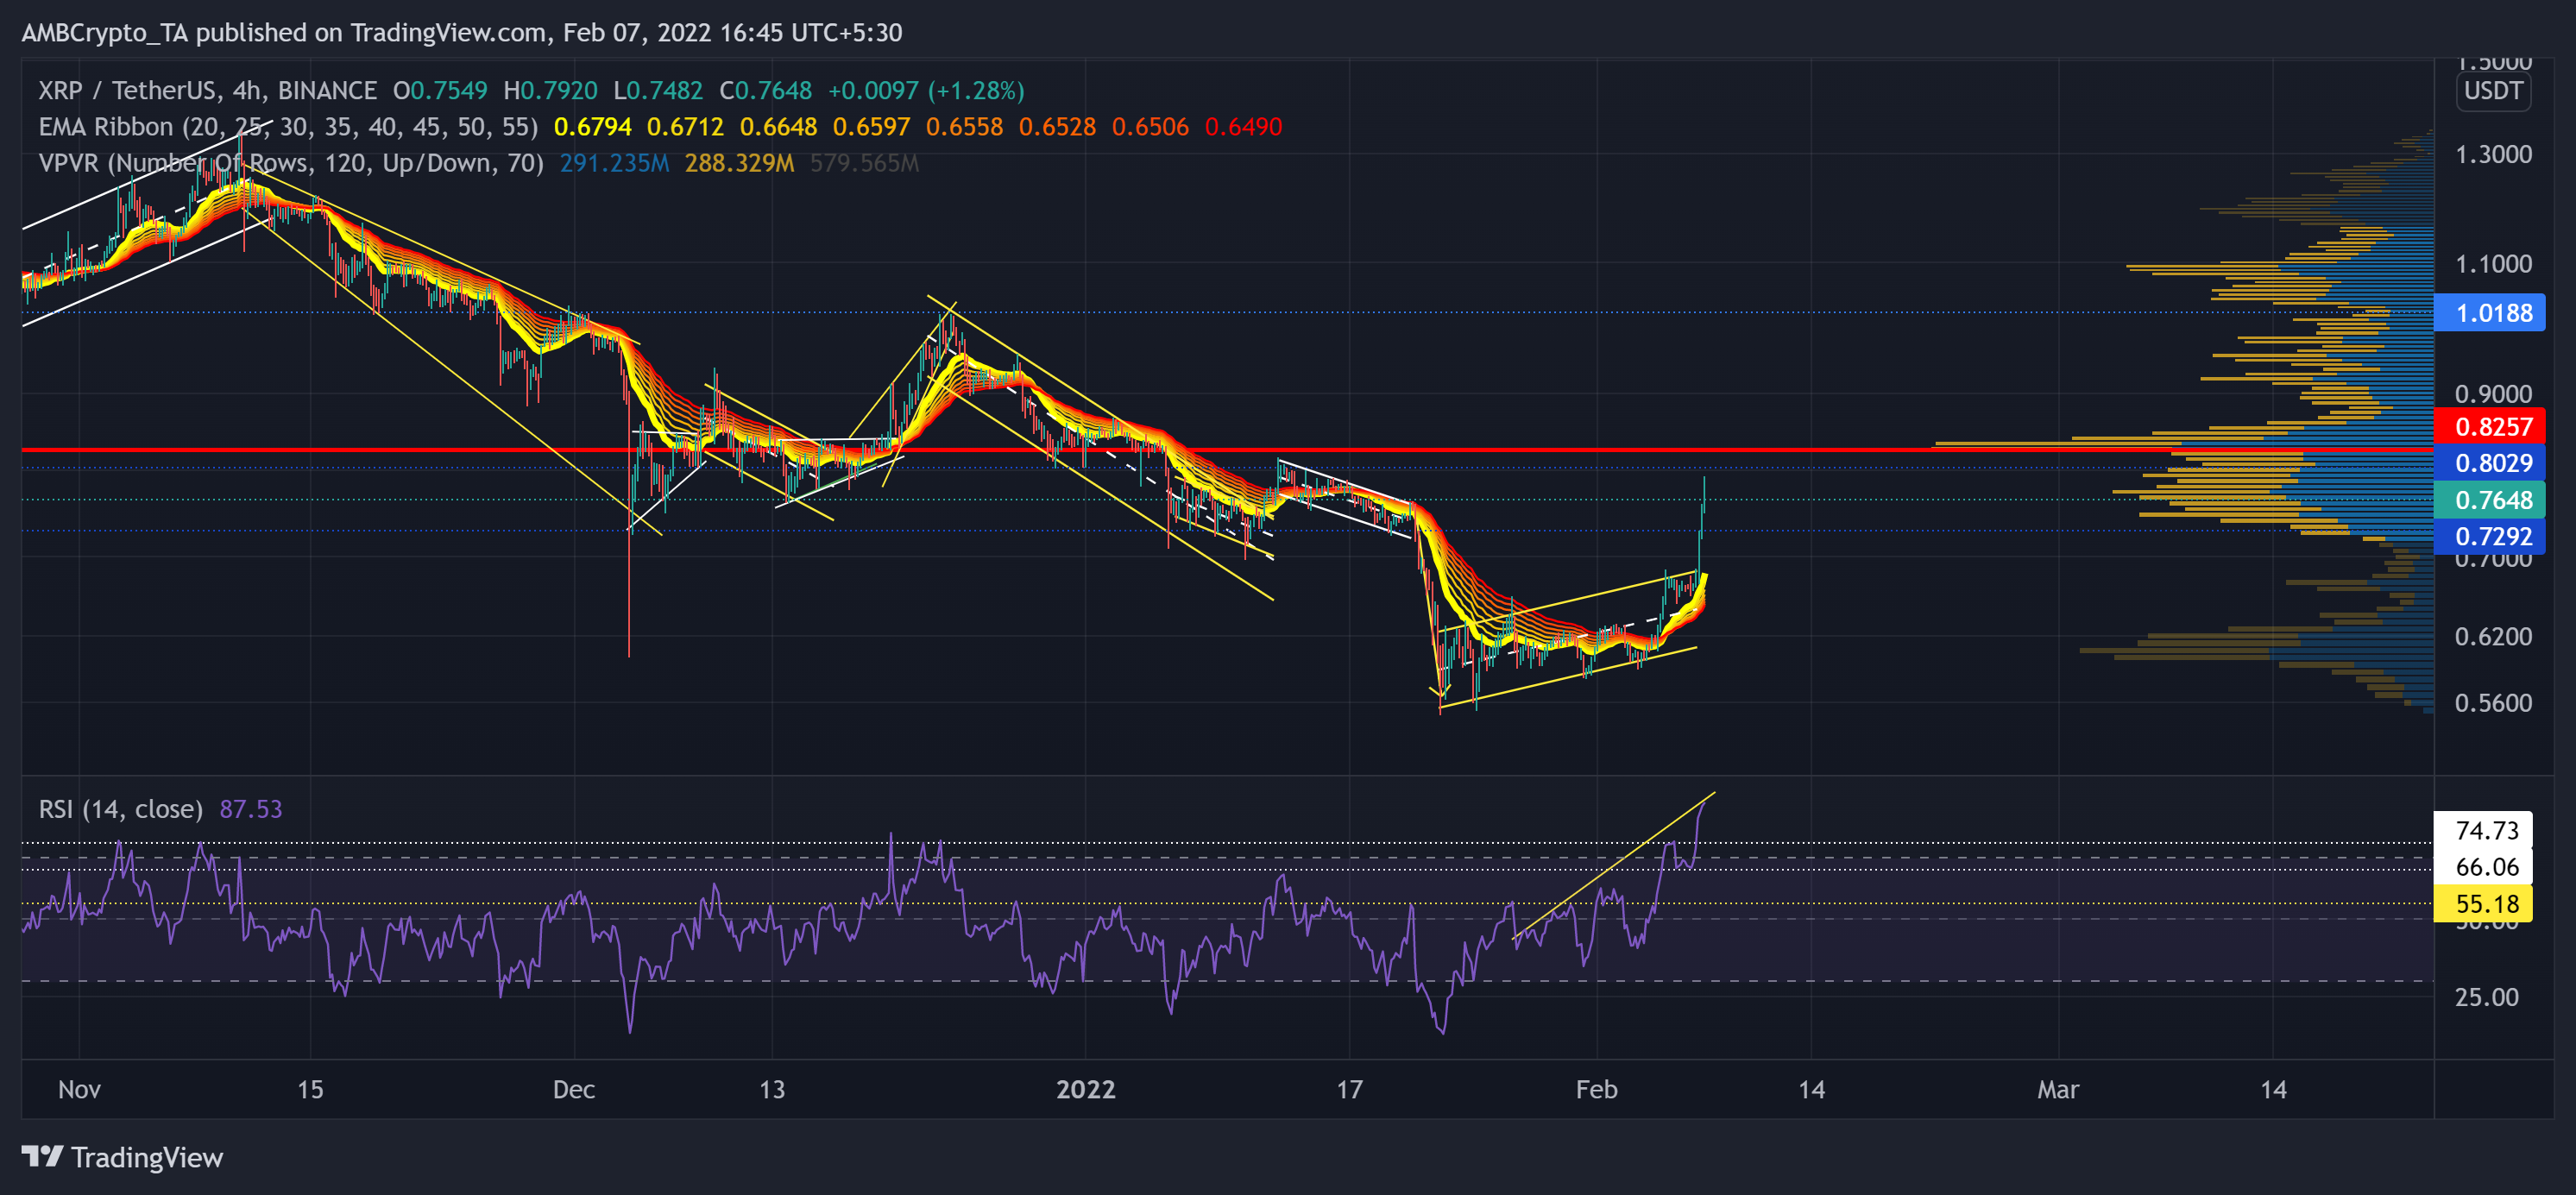
Since losing Point of Control (red) that offered the highest liquidity for over three months, the alt has been on a steady descent. Post that, the bears tested the $0.7292-mark multiple times until the 21 January sell-off. XRP plunged by 32.6% (from 12 January) to touch its six-month low on 22 January.
However, with its 44.4% revival over the past 14 days, XRP swiftly flipped the EMA ribbons in favor of the bulls. Now, any reversal would find a floor near the $0.7292-mark followed by the 20 EMA at the $0.67-mark.
At press time, XRP traded at $0.7648. After testing the 55-mark multiple times, the RSI saw a 35 point surge and poked its six-month high on 7 February. From here on, any retracement would likely lead to a retest of the 74 followed by the 66-mark.
Chainlink (LINK)
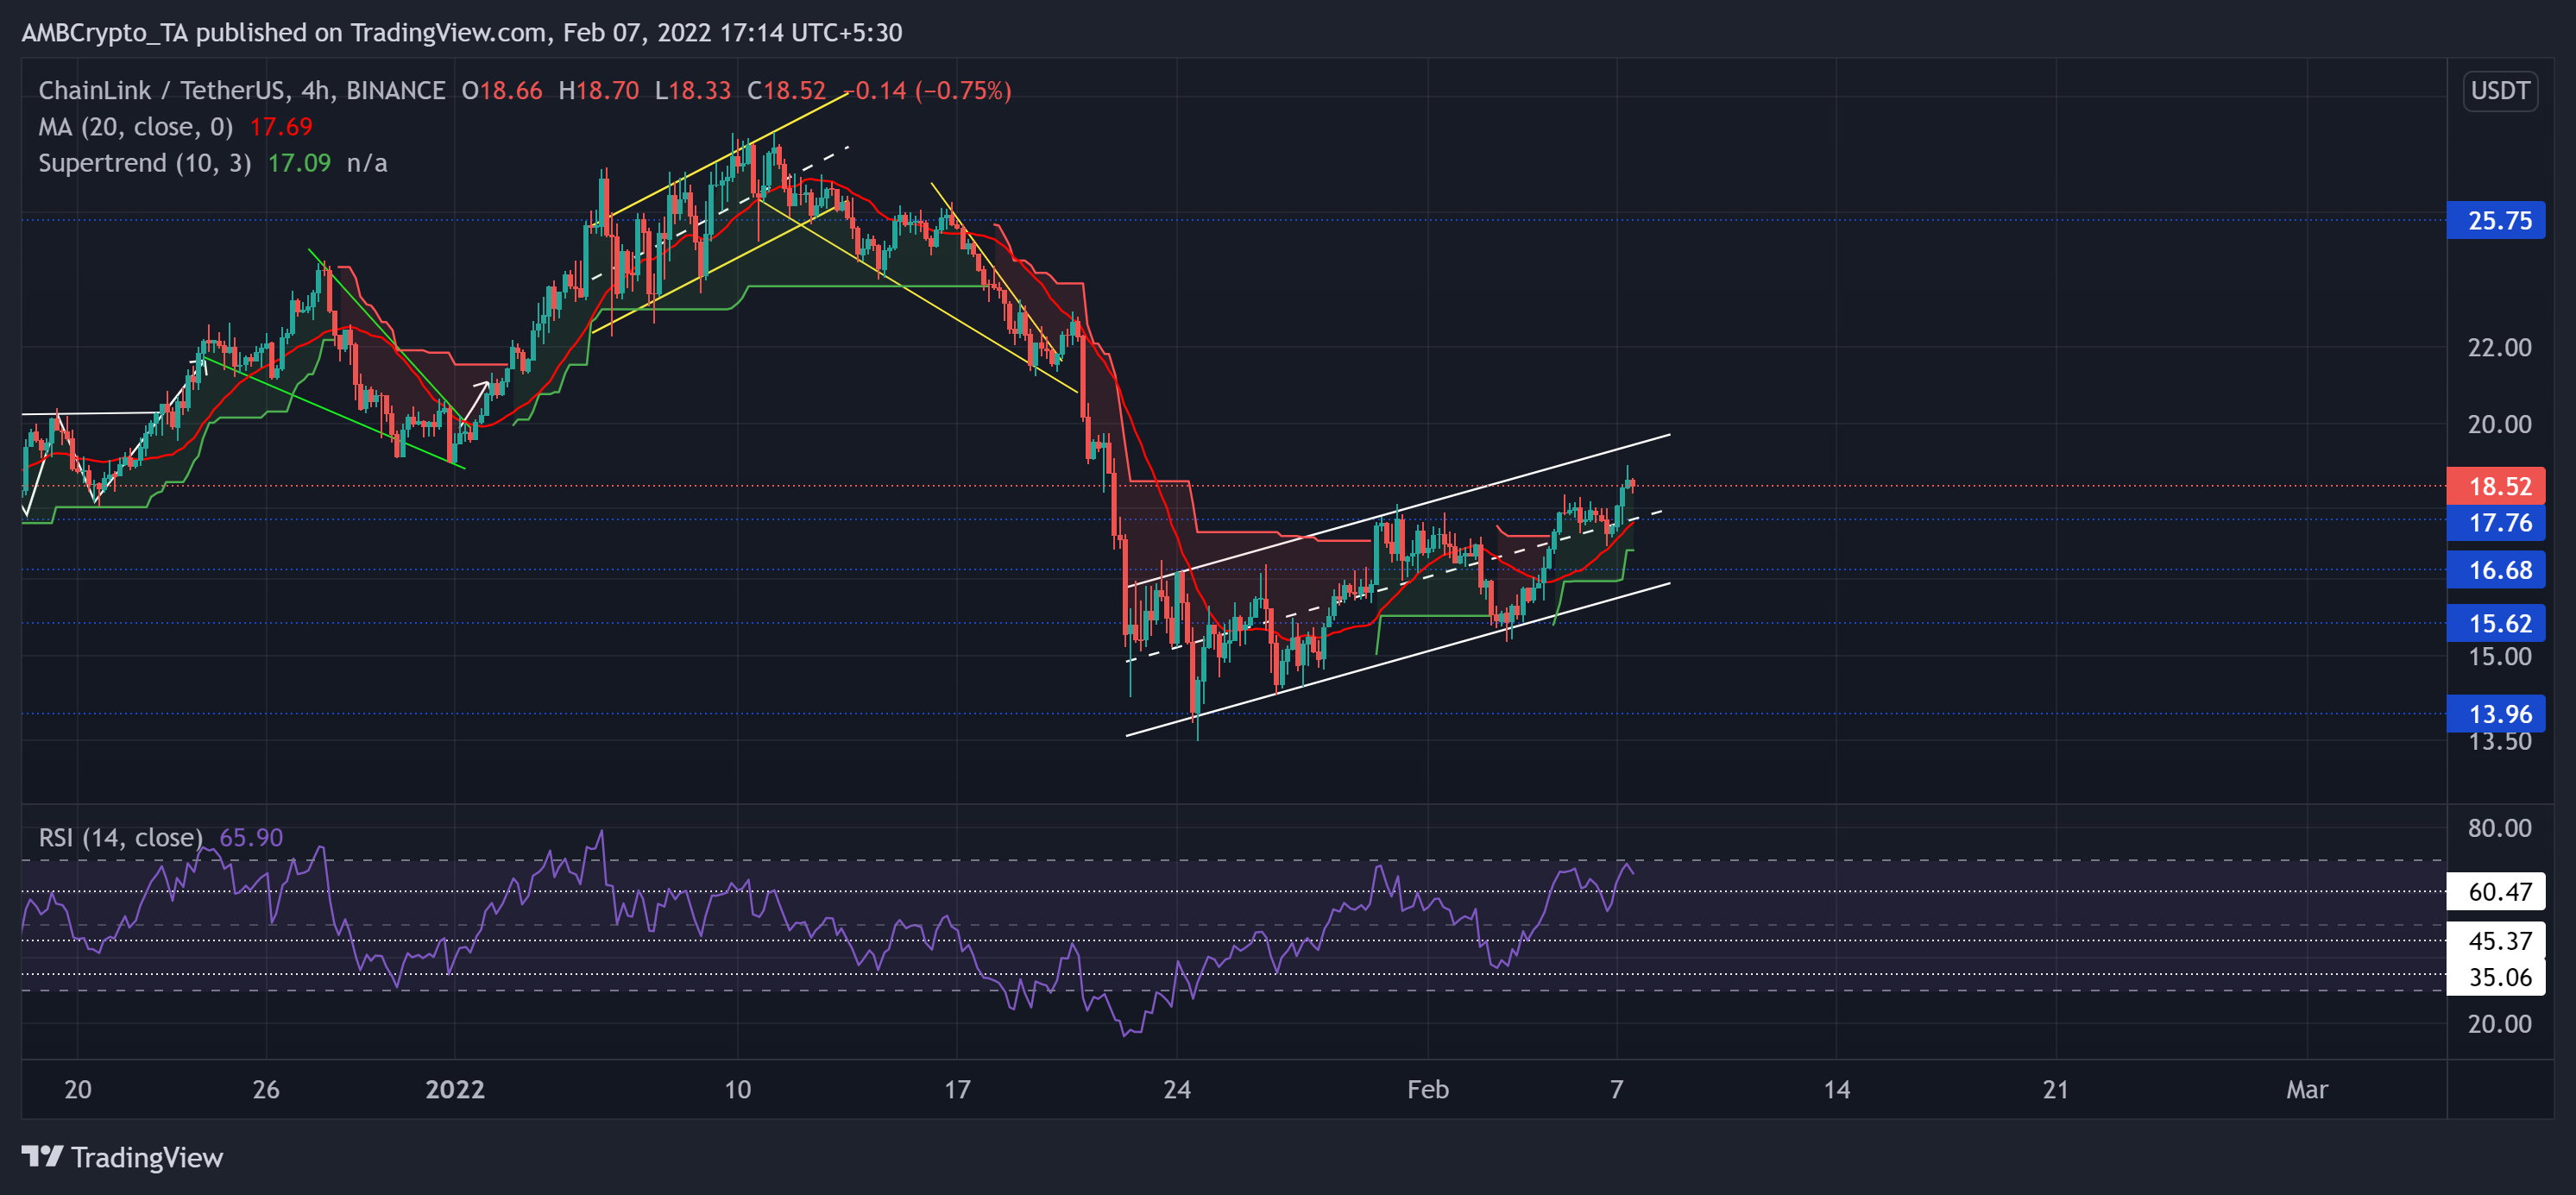
LINK bulls lost control after losing the crucial $25.75-mark resistance (previous support). Thus, the alt plunged by 53.09% (from 11 January) to hit its six-month low on 24 January. However, the bulls finally showed up at the $13.96-mark as the alt recorded a 39.37% recovery until date.
Consequently, LINK pictured an ascending channel (white) on its 4-hour chart. Over the past week, the bulls tested the $17.76-level until finally breaching it on 7 February. Now, any reversals from here would find testing grounds near the 20 SMA (red).
At press time, the LINK was trading at $18.52. After poking the 68-level on 7 February, the RSI slightly pulled back. Any fall below the 60-mark could propel a further downfall. Moreover, the Supertrend displayed a green zone for the buyers.
Enjin Coin (ENJ)
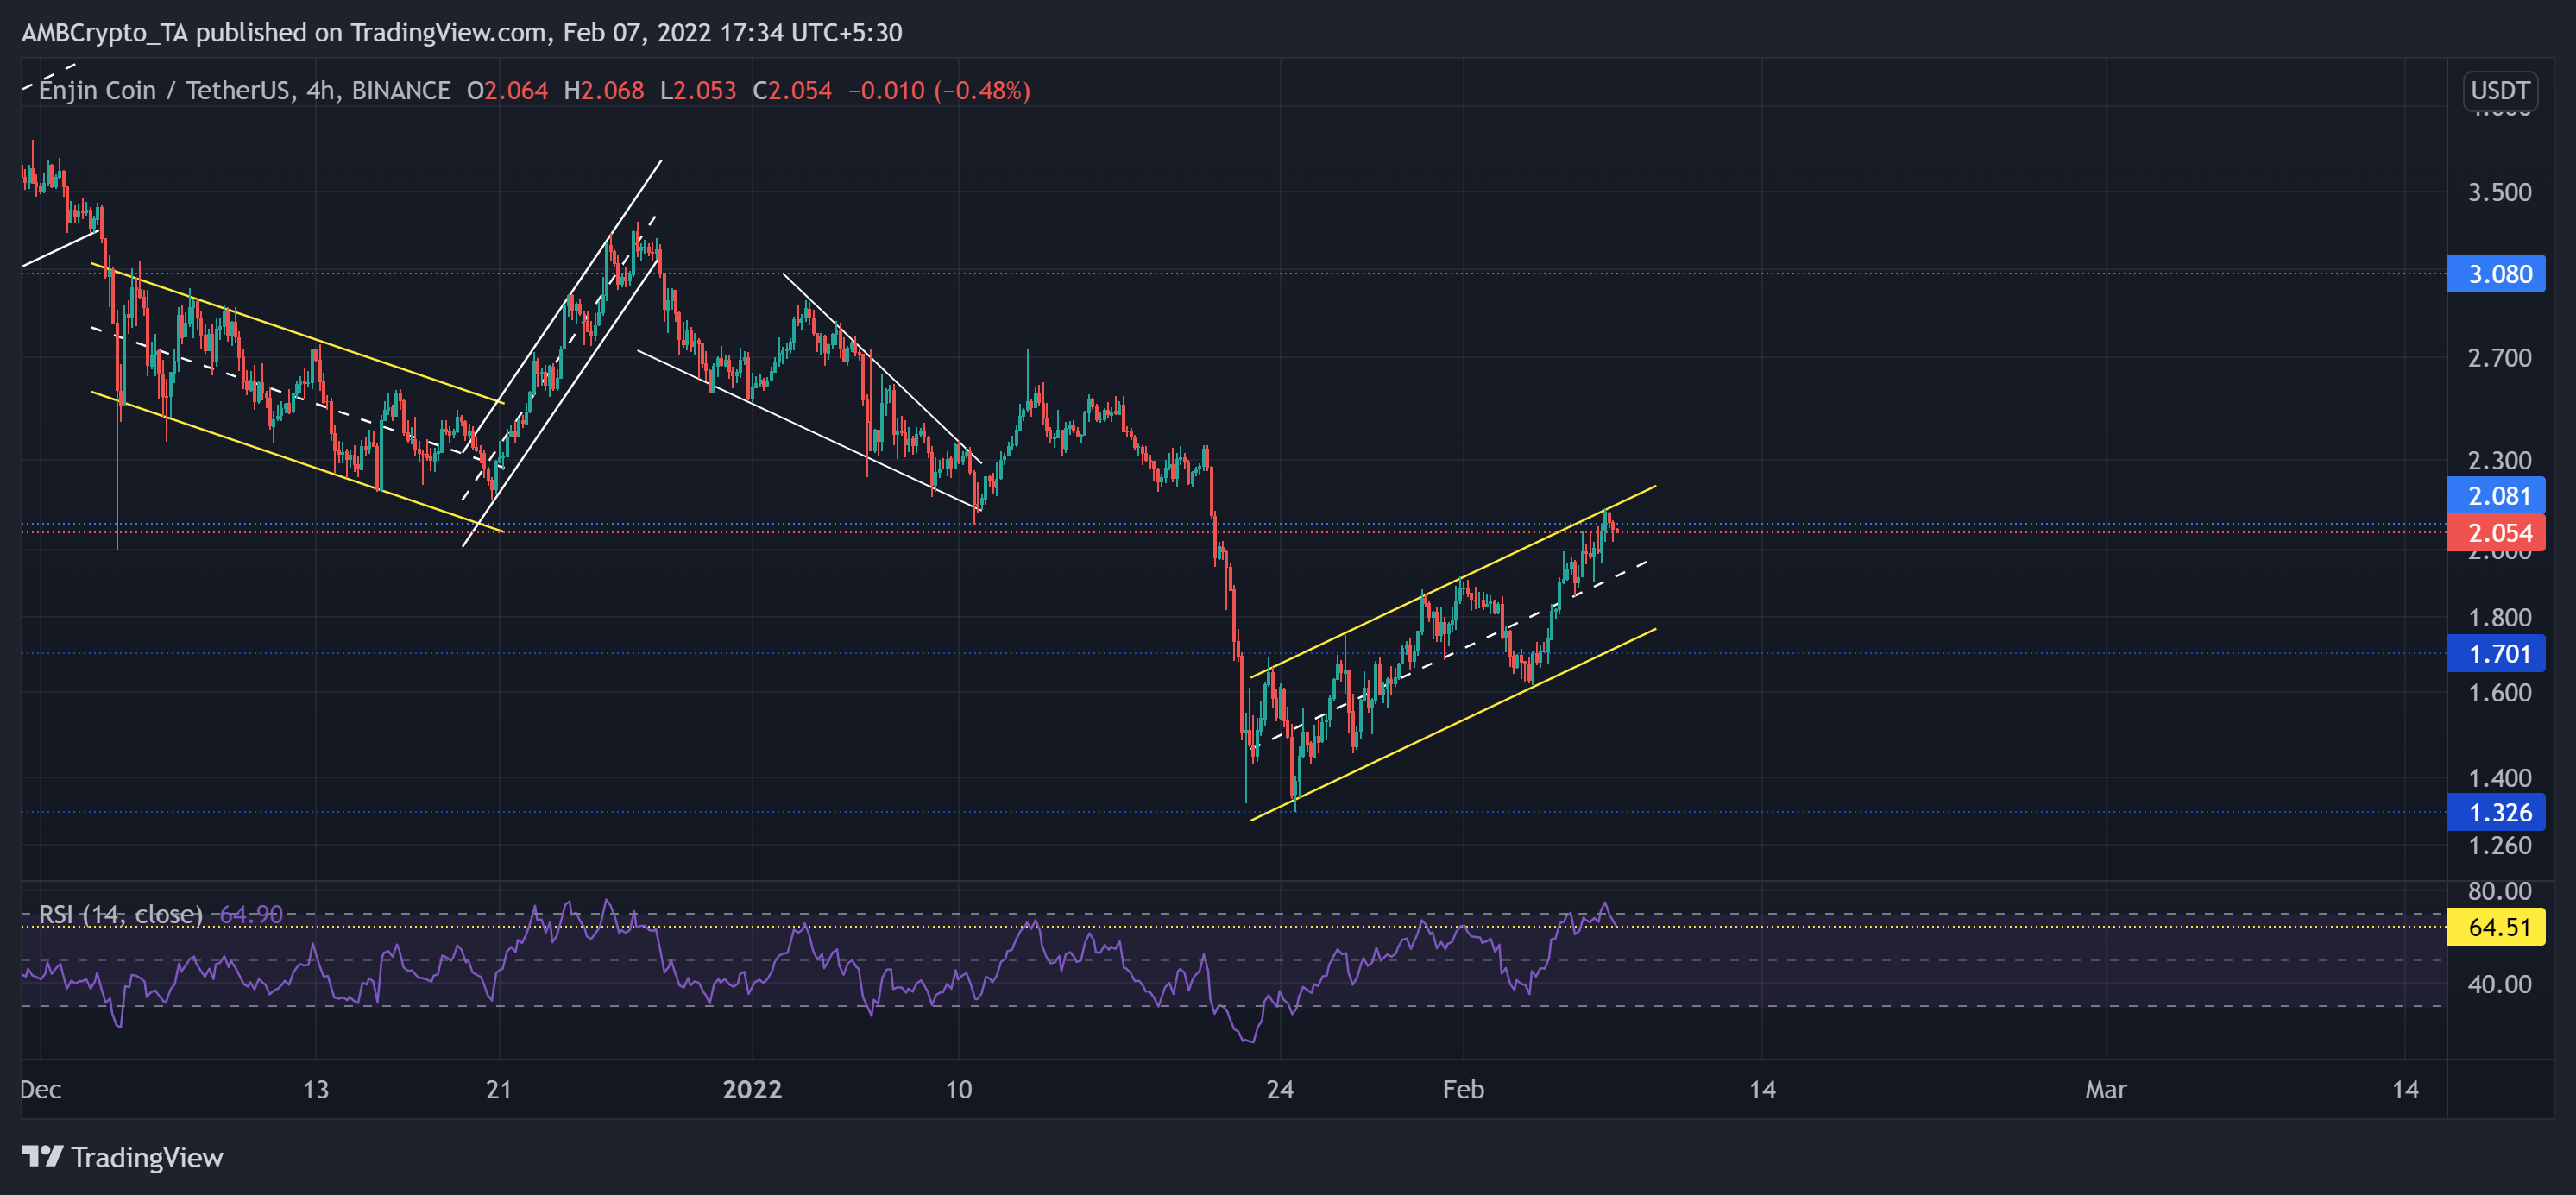
After falling below the $3.08-level, ENJ was rangebound between the above level and the $2.08-mark for seven weeks until the 21 January sell-off. It led the alt to lose over 43% of its value and poke its four-month low on 24 January.
Over the past two weeks, ENJ saw an ascending channel (yellow) on its 4-hour chart. It registered a staggering 57.7% ROI during this rally. But still faced resistance at the $2.08-mark. In case of any retracements, the midline of the up-channel stood as a retesting floor.
At press time, the alt traded at $2.054. The RSI managed to jump into the overbought region after the recent surge. Any fall below the 64-mark could propel a test of the equilibrium.