XRP, Chainlink, VeChain Price Analysis: 25 June

As the market continued to make slow and steady recovery, some altcoins bounced back up earlier than expected while others highlighted more volatility and steeper ups and downs.
With new updates in the SEC v. Ripple lawsuit rearing their heads every other day, XRP hiked after the 21 June fall. VeChain, on the contrary, made headlines after VeTrust, built on VeChain Thor, got adopted by a local Chinese government for better COVID-19 risk management.
XRP
XRP made a swift recovery as it noted 22% gains from its 22 June levels. The asset, after testing the $0.775-support on 21 June, fell below this level and tested the lower support at $0.55. XRP, after testing its lower support, later bounced back and highlighted considerable price gains.
The Bollinger Bands for the asset noted a slight convergence that saw reduced volatility and a less expanded price range as the asset made recovery from its lower lows. Further, bullish momentum could be observed building on the Awesome Oscillator with the appearance of green bars.
The Relative Strength Index for XRP was heading towards the neutral zone and had a reading of 38.43 at press time. The RSI’s uptick underlined an increase in buying pressure, one which pulled the asset from the oversold zone on 23 June. However, sellers were still dominant at press time.
XRP was trading at $0.67 at press time and if its northbound price movement continues, it can test the $0.775-resistance as well.
Chainlink [LINK]
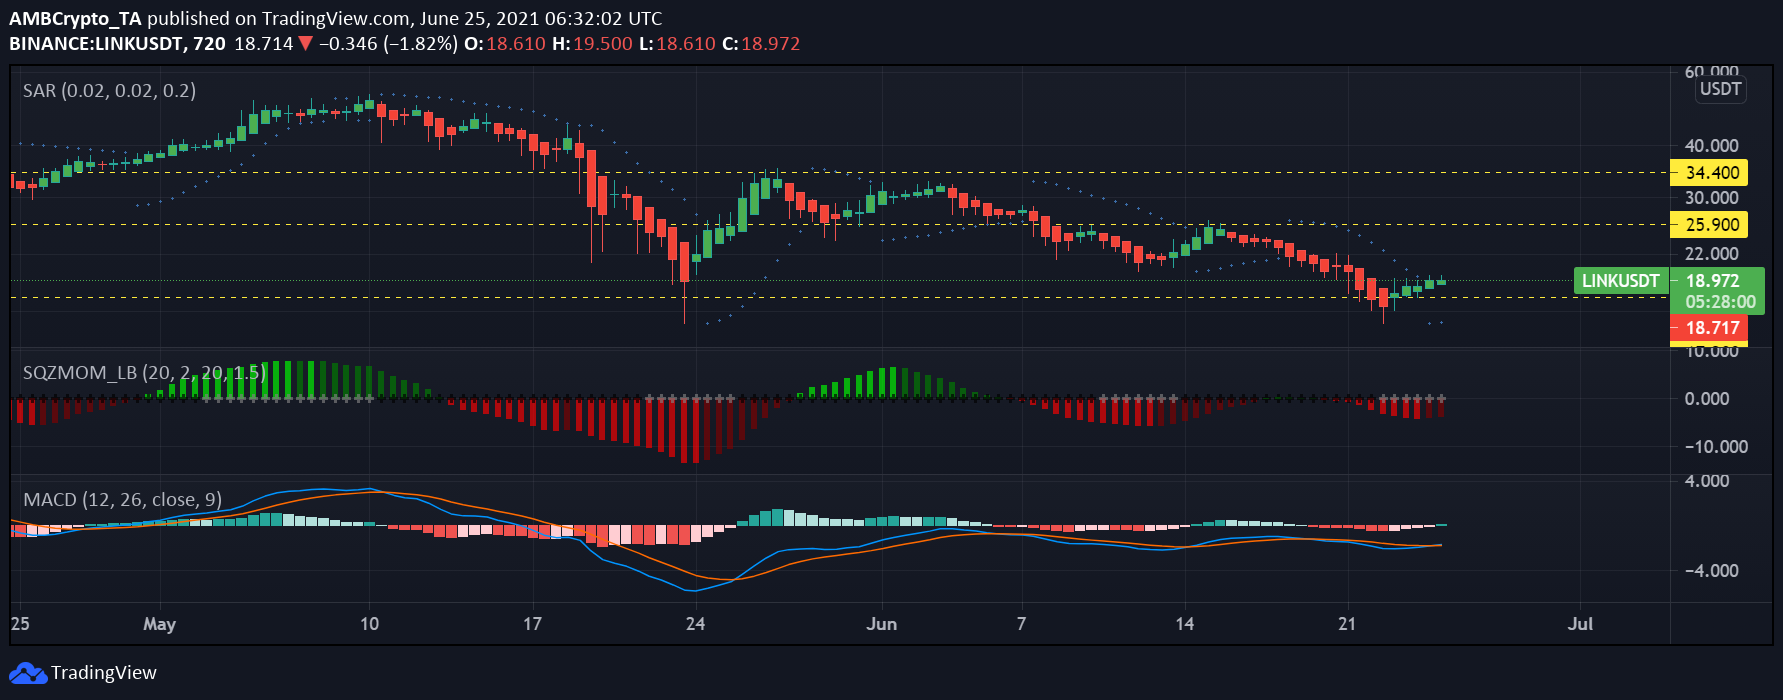
LINK was trading at $18.9 at press time and was down 64.01% from its ATH with a breakeven multiple of 2.78. The alt’s price, after testing the $17.3 support, bounced back and made decent recoveries. The 15th ranked coin had a 24-hour price hike of 3.80% and a 7-day price dip of 16.30%.
In light of the appearance of green candlesticks on the chart, the prevailing trend was slightly bullish. This corresponded with the Parabolic SAR’s white dots that have appeared below the candlesticks since the beginning of 24 June. Further, the Squeeze Momentum Indicator pointed to an active squeeze release (white dots) and projected a bullish trend in store for the asset.
Finally, the MACD and Signal lines underwent a bullish crossover on 24 June, pointing towards a market recovery for the alt. This could lead the asset to rally towards the $25.9-resistance if recoveries continue.
VeChain [VET]
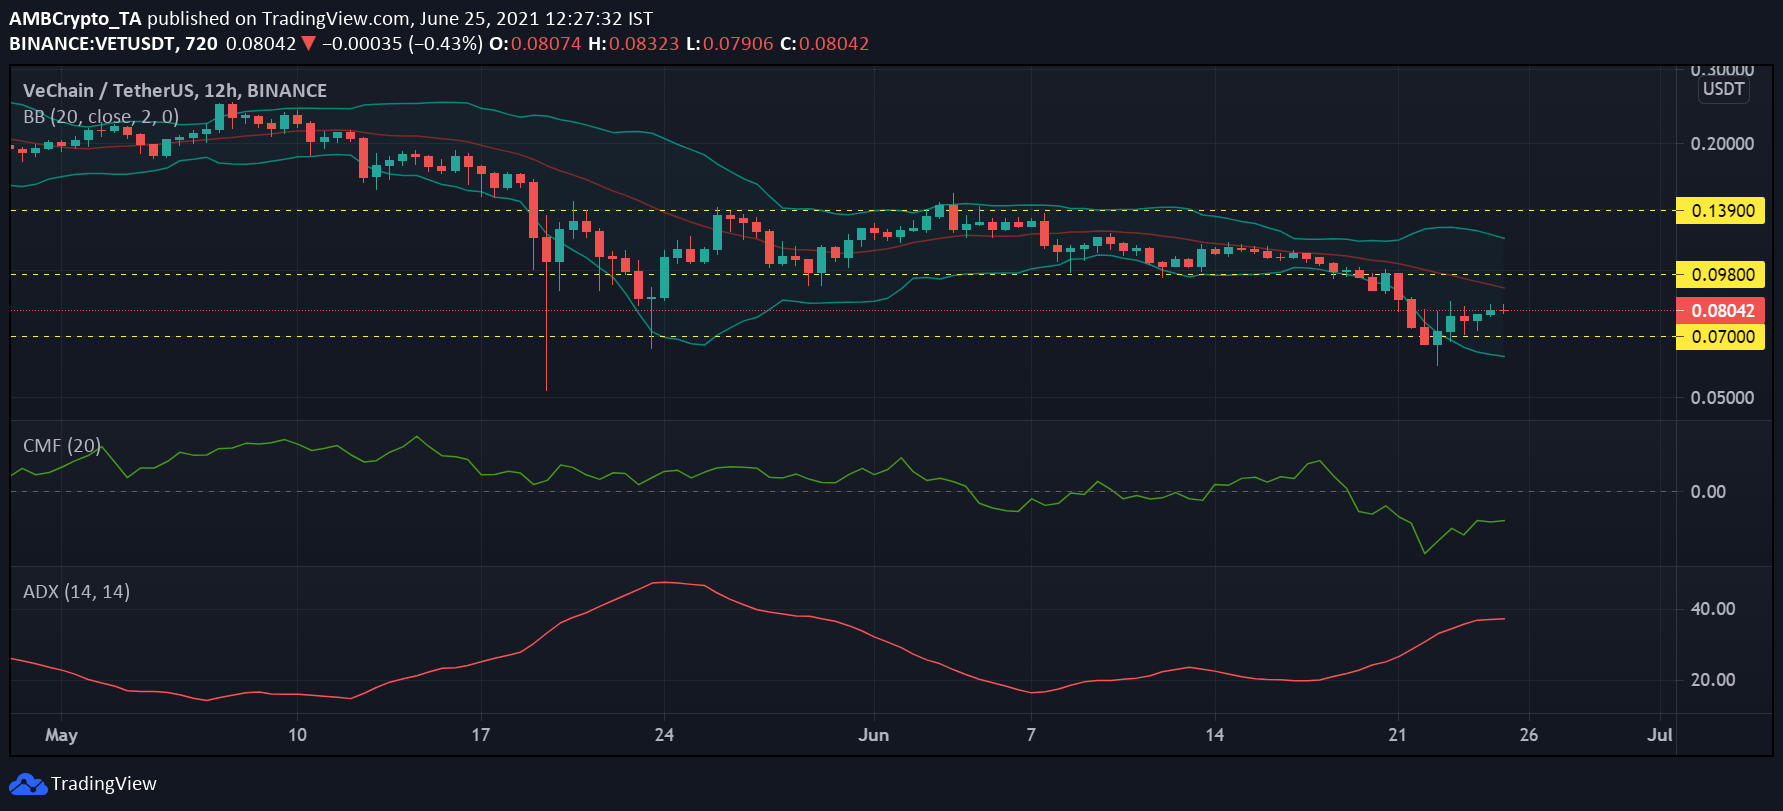
VeChain was trading at $0.08 at press time and was ranked 21st on CoinMarkerCap. The alt saw decent recoveries after the 21 June price fall, and its 7-day price dip was 23.29% while its 24-hour price gain was 5.50%. The asset was down 70.14% from its ATH and had a breakeven multiple of 3.35.
Bollinger Bands for the asset highlighted increased volatility and pictured a more expanded price range as the asset made recovery from its lower lows. Capital inflows for the asset were neutral, according to Chaikin Money Flow, with outflows still dominant in the market.
Finally, the Average Directional Index (ADX), highlighted a non-directional market. Once ADX is under 25, an uptrend can be expected to become stronger. The alt, after testing its lower support at $0.07, bounced back up and if the price rallies further it could touch the resistance level at $0.098.


