Analysis
XRP continues sideways movement as bears block its path
XRP, third-largest cryptocurrency in terms of trading volume, was priced at $0.261 as its value dropped by 0.25% over the 24-hour cycle. With a market cap of $11.241 billion, XRP recorded $1.053 billion trading volume over the past 24 hours, at press time. Majority of the trading volume was generated over the BCEX exchange using XRP/USDT trading pair, according to CoinMarketCap.
1-Hour XRP Price Analysis
In the one-hour chart, XRP received support at $0.259 and $0.250. The digital asset faced resistance at $0.265. As the digital asset recorded a sharp uptrend from $0.262 to $0.265 along with a downtrend starting from $0.264 and ended at $0.261.

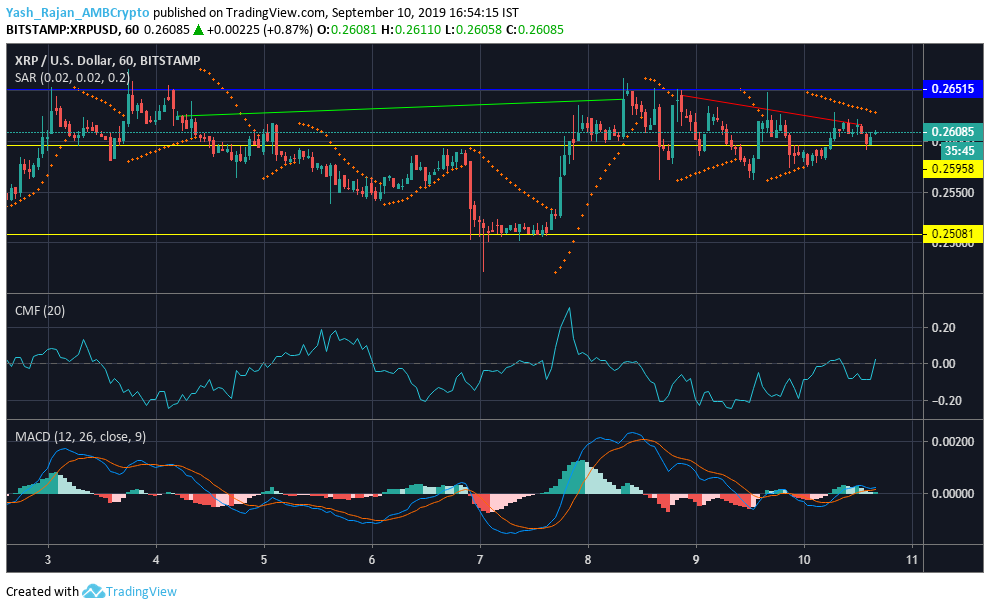
Source: TradingView
Parabolic SAR pointed towards the bearish trend as the dotted markers were present above the candles.
Chaikin Money Flow or CMF was positioned just above zero-line at 0.02. As it remained above the zero-line, it indicated that a significant amount of capital was flowing into the market.
The MACD line crossed above the signal line, revealing a bullish trend with a slight chance of reversal.
1-Day XRP Price Analysis
In the one-day chart, XRP formed support at $0.247. The digital asset faced resistance at $0.474. XRP recorded a sharp downtrend from $0.461 to $0.260. Previously, Ripple’s token recorded an uptrend from $0.314 to $0.459.
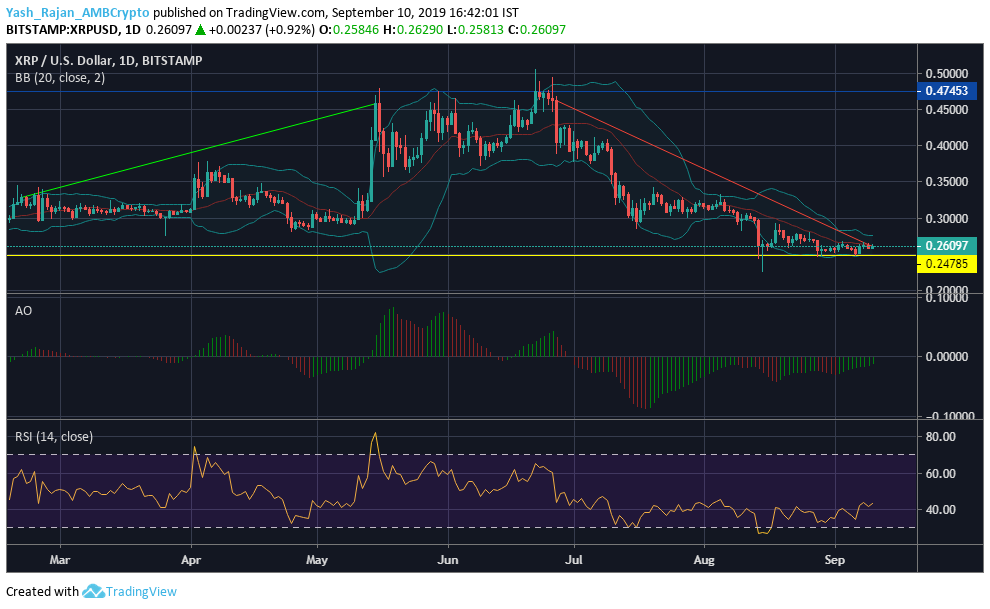
Source: TradingView
The Bollinger Bands were squeezing, picturing a reduced amount of volatility in the market.
Awesome Oscillator conveyed that long-term momentum was greater than the short-term momentum. With a bearish setting opportunity, the green lines appearing at the end further indicated the possibility of a bullish market ahead.
The RSI indicator stood at 43.39, displaying that selling pressure was high.
Conclusion
Charts revealed that XRP was present in the bearish zone, as exhibited by indicators.