XRP continues to navigate through bearish tides and price consolidates lower in the charts
Since breaching the $0.42539 support in late June, XRP has been on a downward trend with a current valuation around $0.26. The recorded market cap at press time was around $11,194,094,028 and the 24-hour volume was $1,149,539,692, having experienced a 0.15 percent hike in the last day.
XRP was traded the most on the RightBTC exchange which was responsible for 11.26% of the overall trade.
1-hour chart

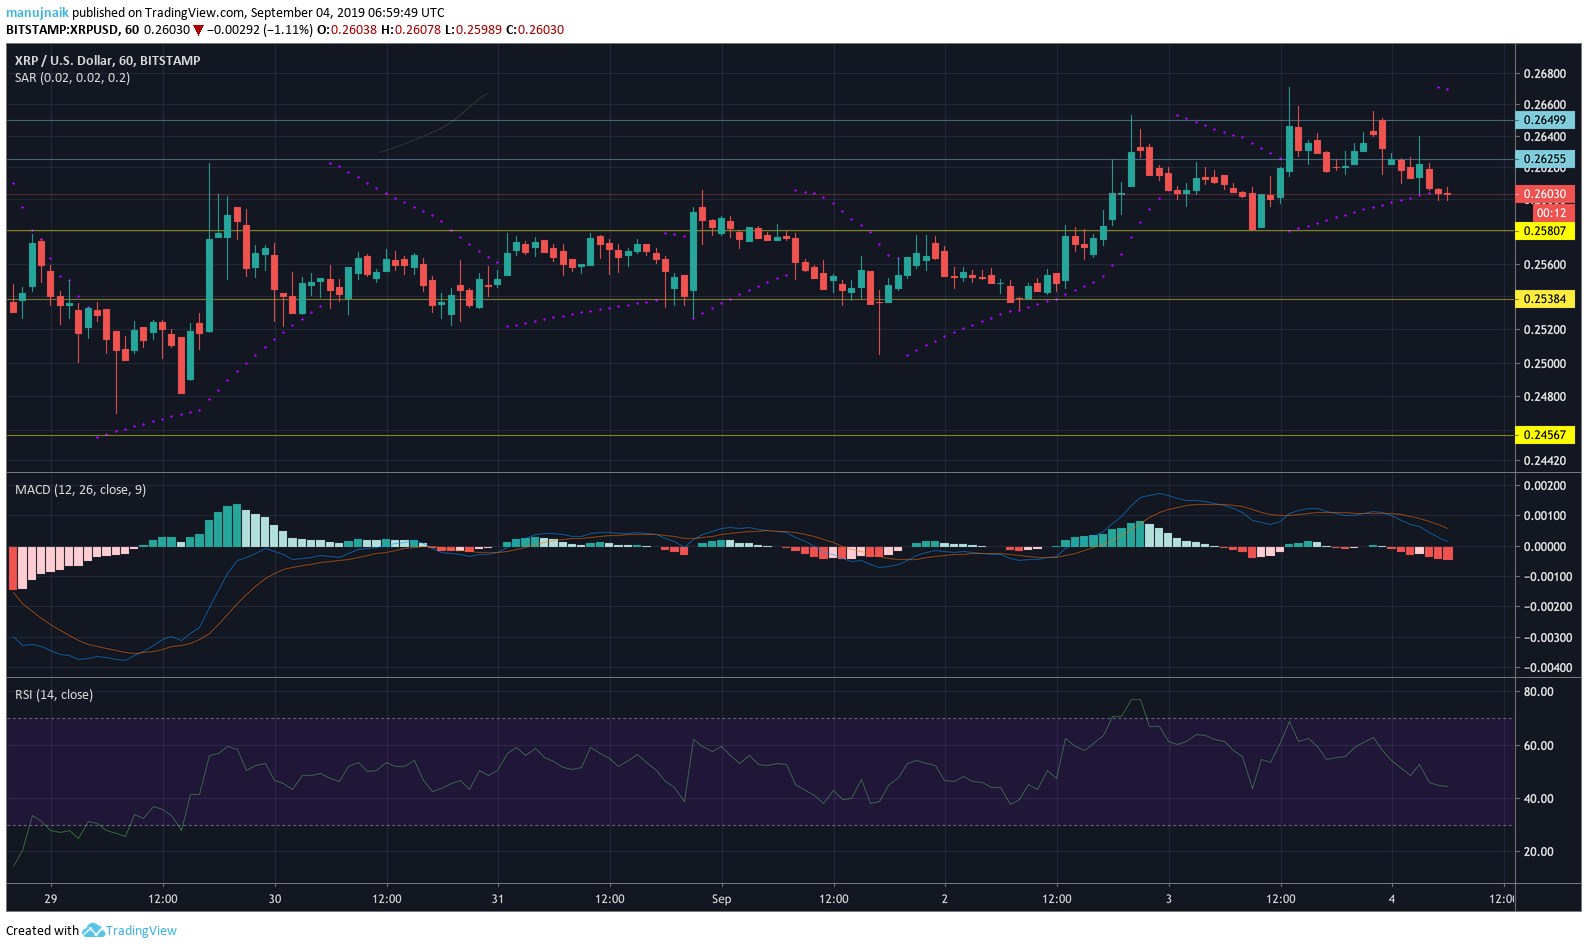
Source: Trading View
Resistance 1: $0.26255
Resistance 2: $0.26499
Support 1: $0.2584
Support 2: $0.25807
The short term chart of XRP witnessed a slight downtrend which stretched the valuation from $0.26499 to $0.26030.
Relative Strength Index, moved between the 60 and 40 mark lines, indicating the token had been neither oversold nor overbought.
Parabolic SAR suggested a bearish short-term as it crossed over from under the candles.
The MACD line remained bearish on the short term as the blue line crossed over the red line into a downwards trend.
1-day chart
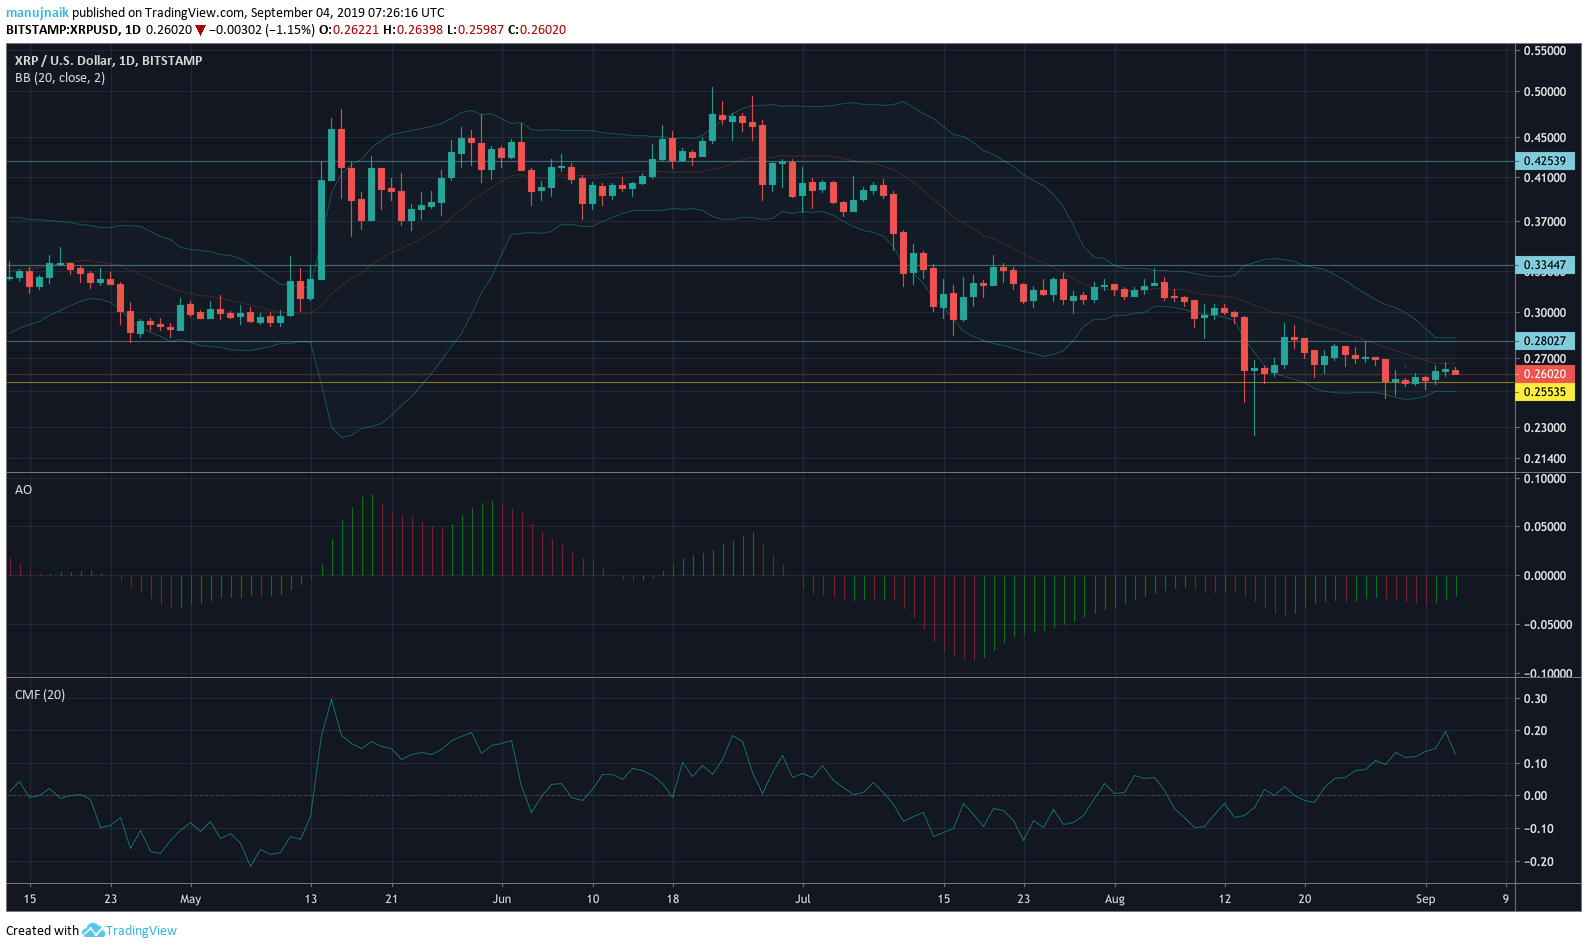
Source: Trading View
Resistance 1: $0.28027
Resistance 2: $0.42539
Support 1: $0.25535
The long term chart indicated that the price of XRP had been oscillating between Resistance 1 and Support 1 for over two weeks. After the price has been on a bear run since late June, the price attained sideways movement without any resistance breach.
Chaikin Money Flow indicated higher capital in-flow than out-flow.
Awesome Oscillator exhibited the appearance of green but the bullish momentum was fairly weak.
The slight converging of the Bollinger Bands indicated that price volatility has reduced at press time.
Conclusion
XRP looked to be bearish in the short-term and the long-term charts indicated low volatility and slight bullish movement.