XRP could break down from wedge to $0.11 before 2020

Towards the end of November, XRP touched the $0.19 mark, a value the cryptocurrency last touched in December 2017. With a valuation of $0.21 at the time of writing, XRP had a market capitalization of over $9.35 billion and a 24-hour daily trading volume of $1.35 billion, according to CoinMarketCap. It was traded most on the IDCM exchange which accounted for nearly 7% of the trade volume over the 24-hour period.

Source: CoinStats
XRP 1-day chart

Source: XRP/USD on TradingView
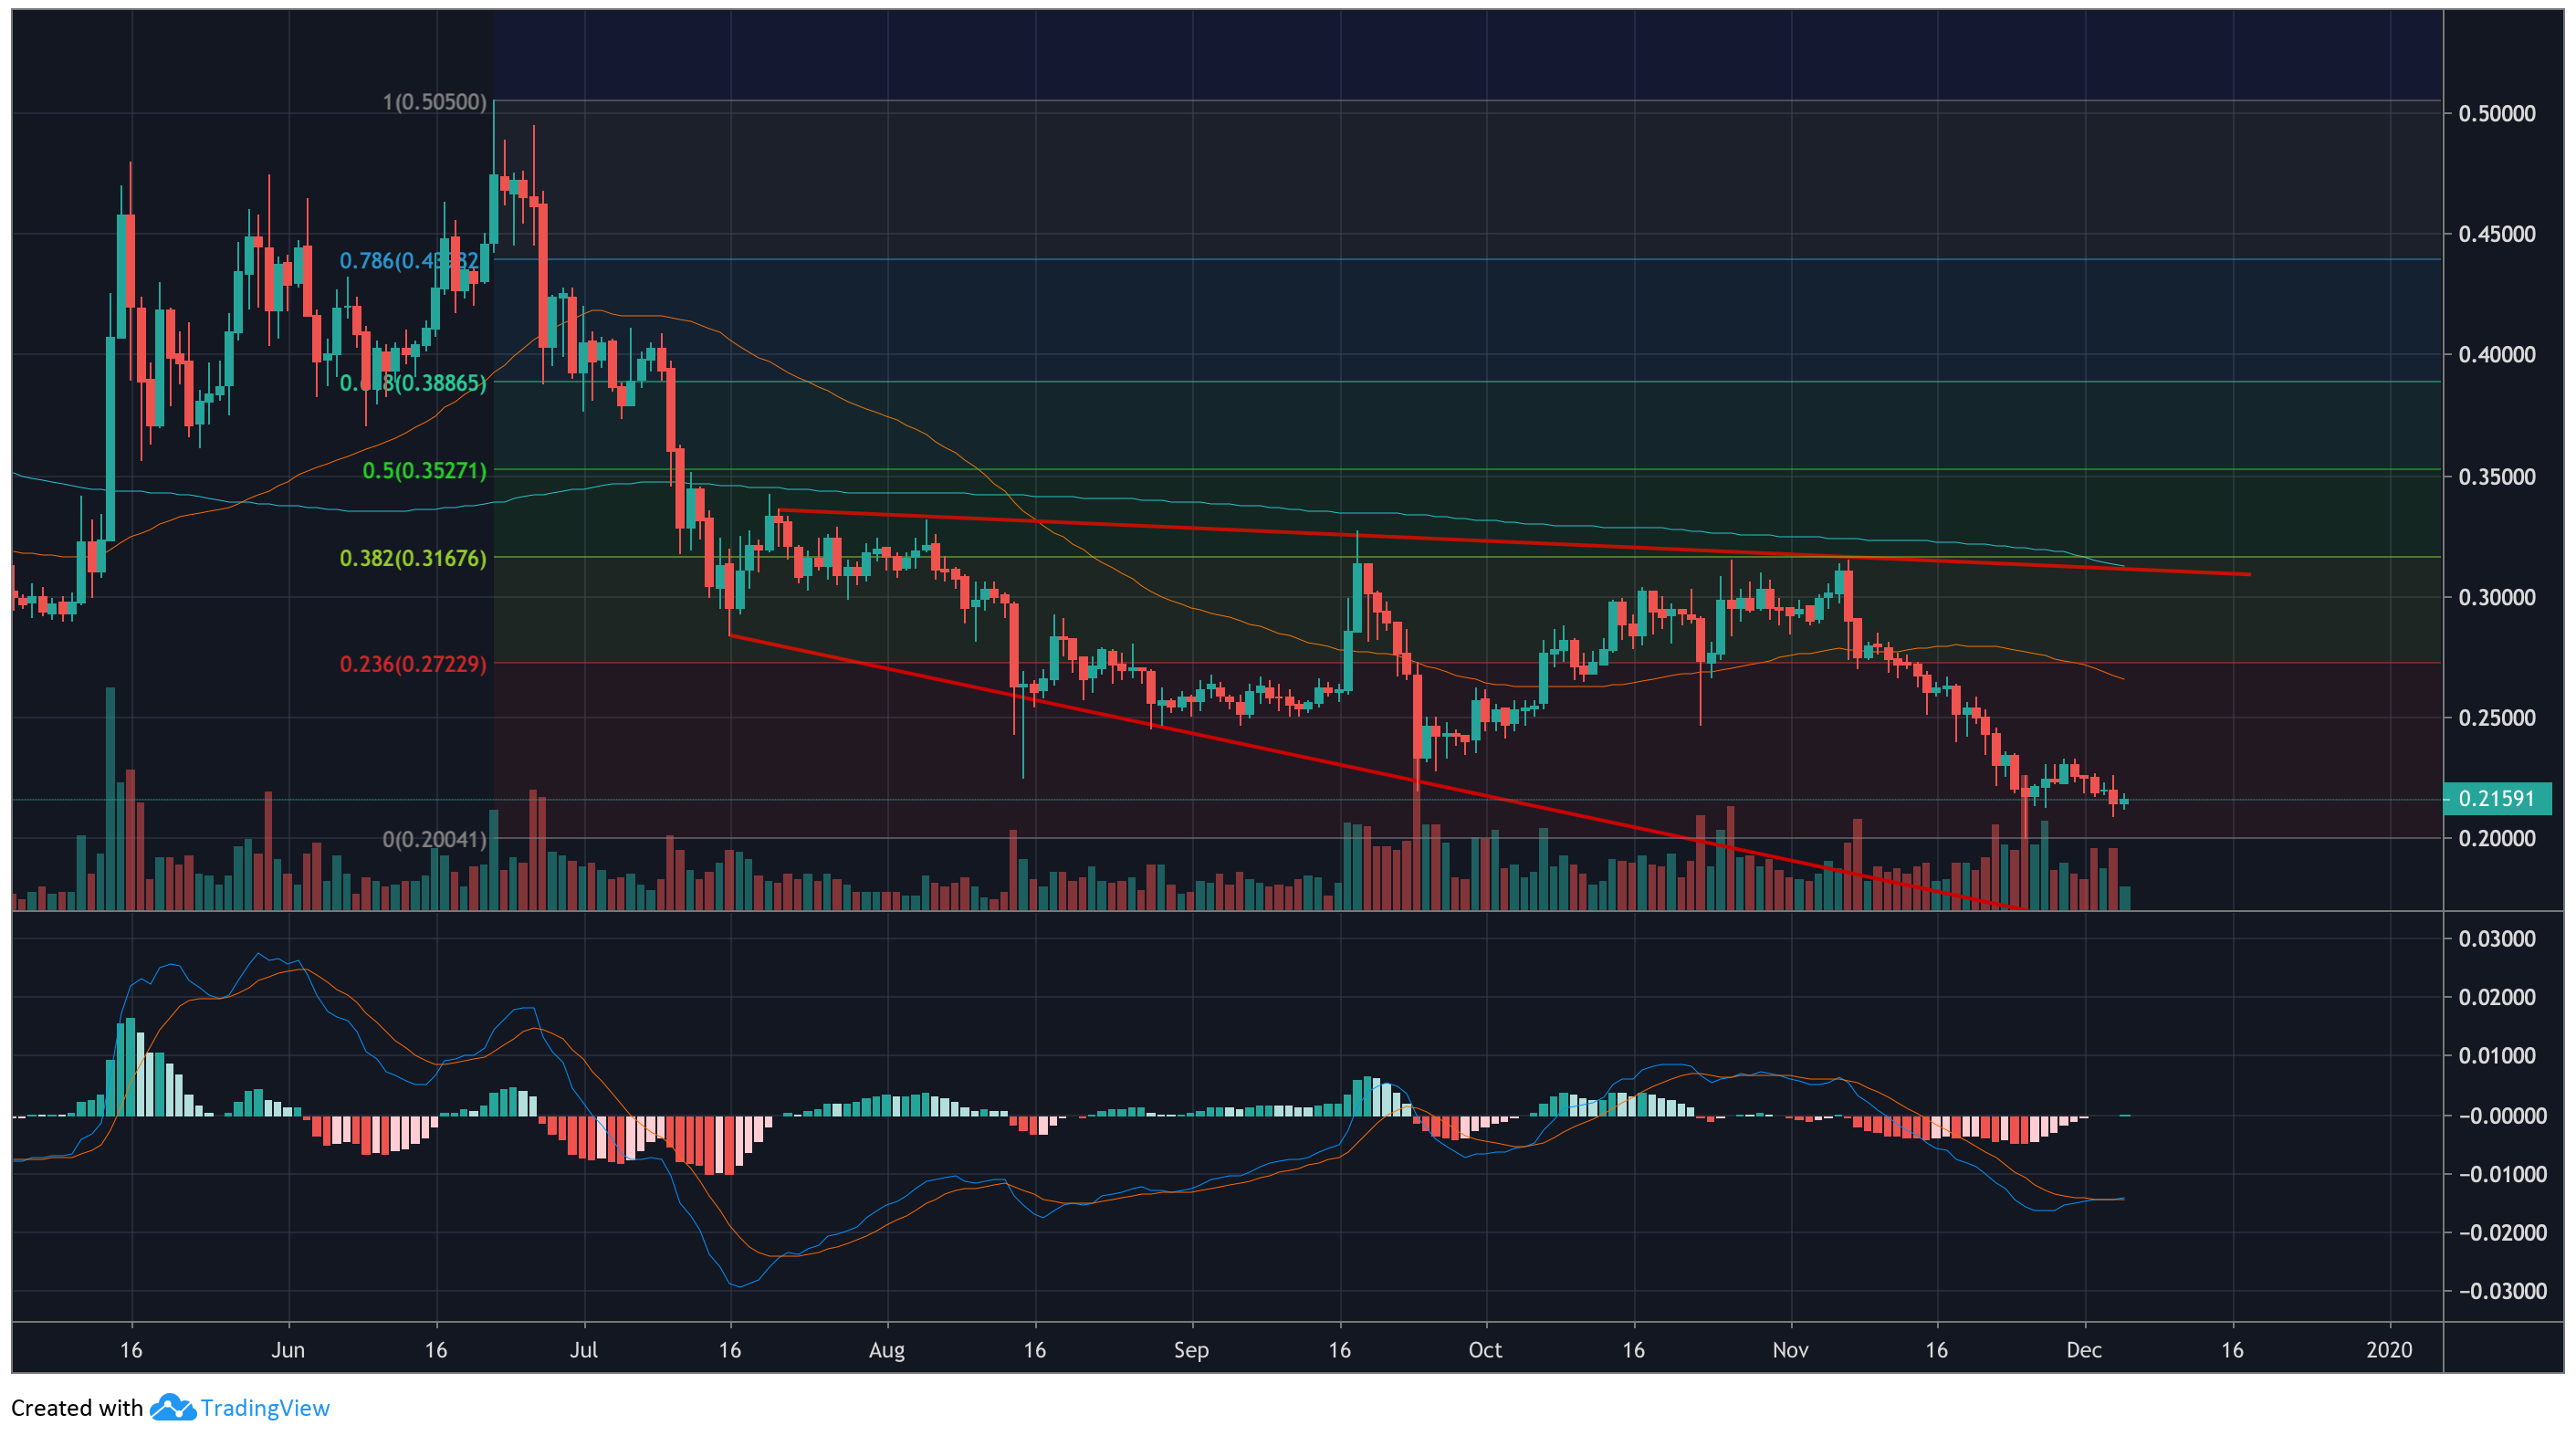
The 1-day chart showed that XRP entered a descending broadening wedge pattern around mid-July. As can be seen in the attached chart, these patterns are usually accompanied by an upward trend in volume. Descending broadening wedge patterns tend to exhibit trend-reversing breakouts in 58% of cases, making a slightly more supportive case for an upward movement in price.
The MACD indicator could be seen showing the signal and MACD lines moving around the same level, having just completed a bullish crossover with very low bullish momentum. The 50 and 200-day moving average were both traveling above the price line, with the mid-August death cross still in play, applying additional bearish pressure on XRP.
Having tested the 38.2% Fibonacci retracement line more than once over the last couple of months, an upward breakout could see XRP move up to $0.41 by the end of the year. However, this seemed unlikely given the bearish signals from indicators. It’s far more likely that XRP will break down from the pattern to around $0.11 in the same duration of time as the bullish case.


