XRP could see a short-term bounce but the downtrend remains unbroken

Disclaimer: The findings of the following analysis are the sole opinions of the writer and shouldn’t be considered investment advice
On shorter timeframes, a bounce in prices for most of the crypto-market seemed to be inbound as Bitcoin registered some gains recently. Over the past few days, the stock markets across the globe have also seen a bounce, which gave investors some confidence and made crypto a little less scary than it had been when the selling pressure hit hard.
For XRP too, this positive sentiment could see the price climb somewhat in the days or weeks to come. However, it has strong resistance levels to the north. And, a move above these levels is not yet in sight.
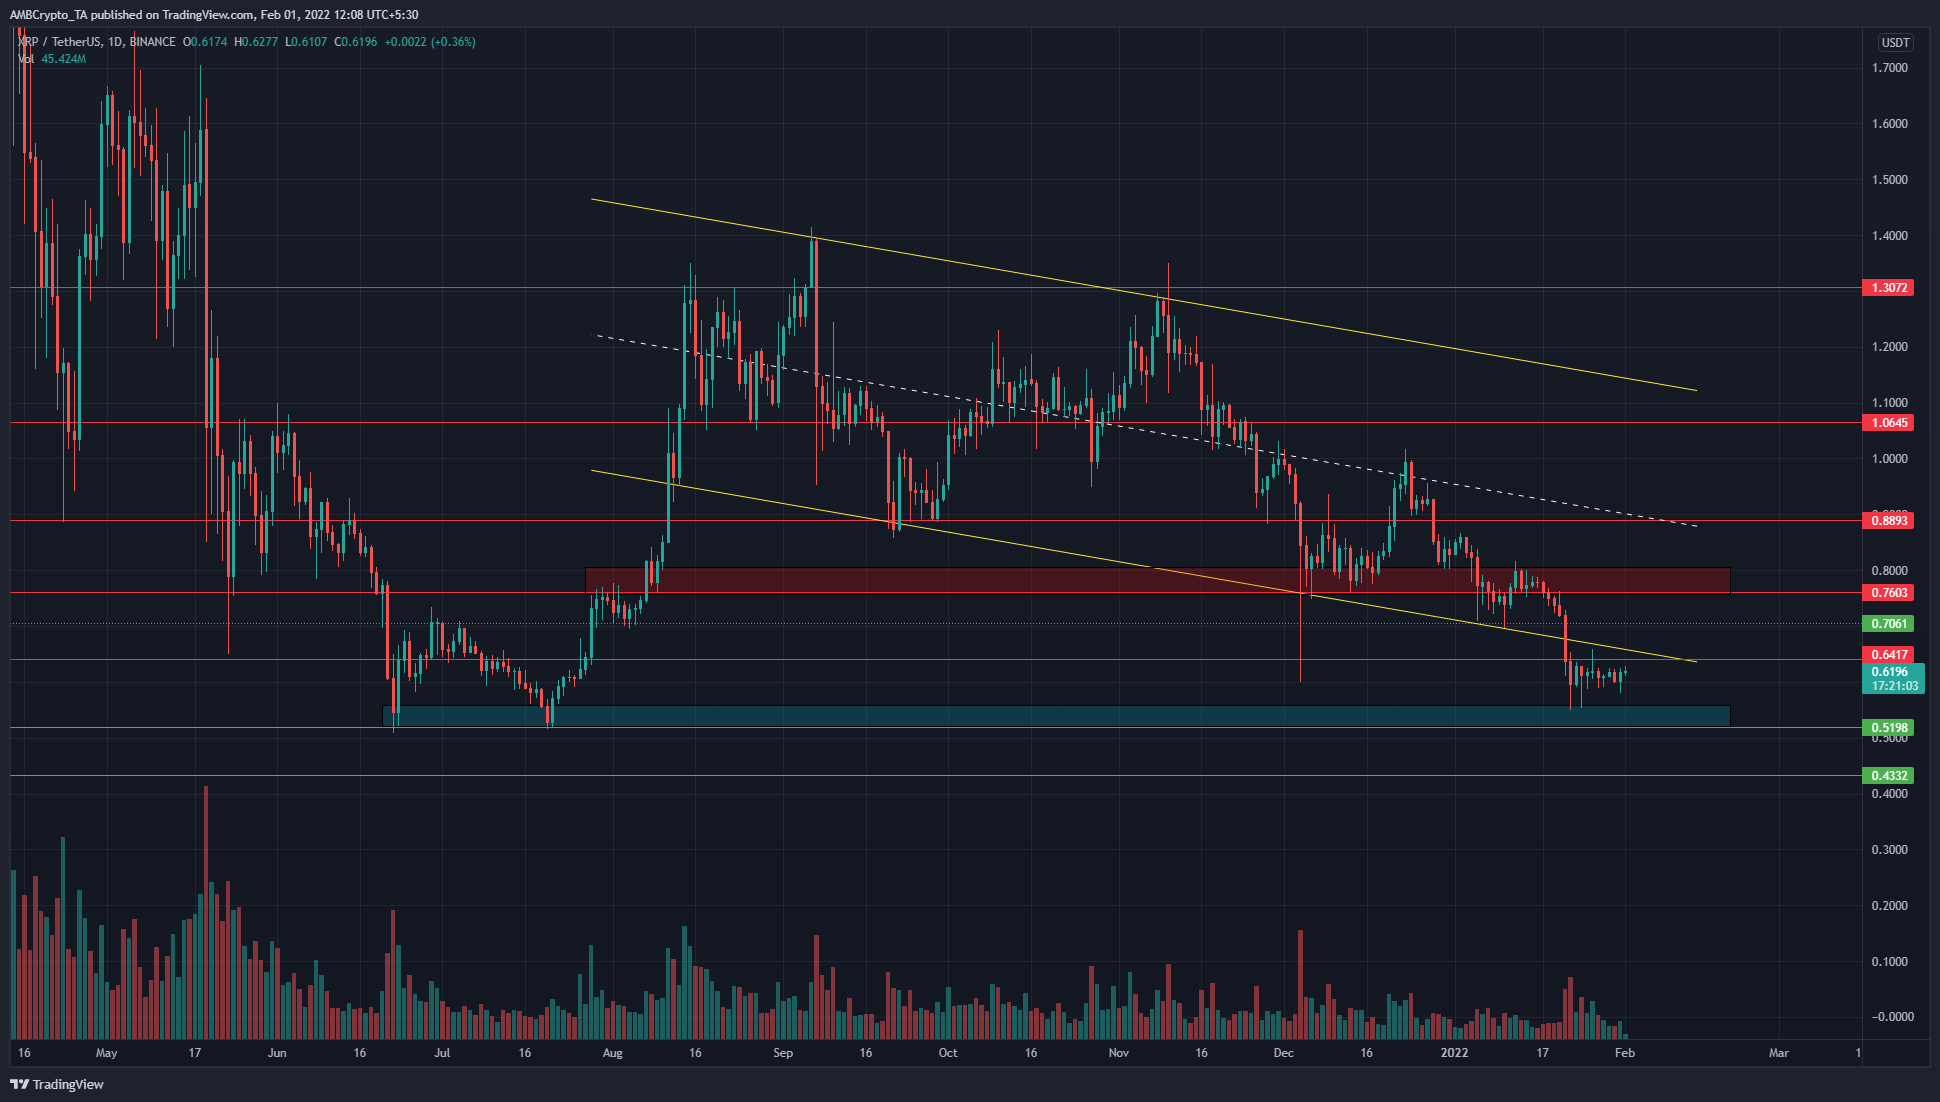
In a previous article, it was pointed out that the $0.51-support level could act as a demand area. This has been the case in the past week, as a daily session’s candlewick to $0.55 was quickly bought up. This pointed to some demand in this area.
The price broke beneath the long-term descending channel (yellow) that XRP had been trading within since August. The channel lows and the $0.64-resistance level offered some confluence in resistance levels to XRP, with $0.7 also being a level of resistance above.
Over the next few days, the bullish momentum over the past few days could continue and could see XRP climb, perhaps as far as $0.7. This move could trick some market participants into believing a bullish trend was established. XRP could reverse after selling into these buy orders, which would see the price drop towards $0.51 once more (bull trap or double pressure).
XRP would need to climb above $0.76 and flip it to support before the downtrend can be considered broken. The previous lower high lies at $0.816 and is the level to flip to shift the market structure.
Rationale
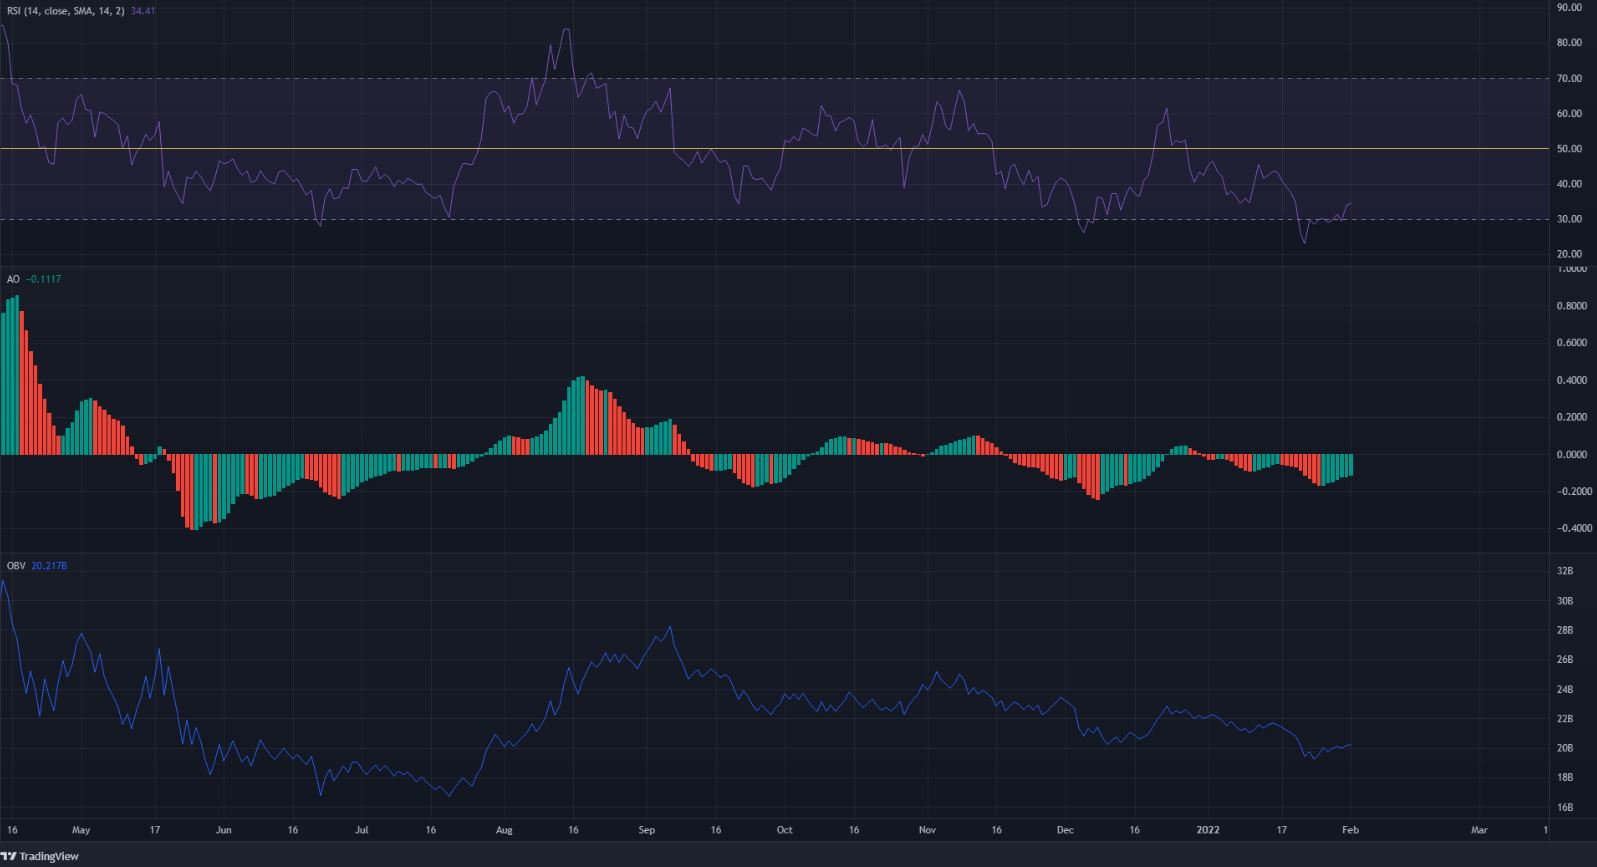
The RSI dropped below 30, and at the time of writing, was climbing. Generally, when the daily RSI drops below 30 for XRP, it manages to climb at least as high as 40 and sometimes, even above neutral 50.
The Awesome Oscillator continued to remain below the zero level, while the OBV was also on a downtrend. Both these indicators showed that bearish momentum was strong, and selling volume has also been steady.
Conclusion
In the long-term, a sustained downtrend appeared likely. A move above $0.76 and $0.816 would be necessary to suggest that the bearish market structure is broken.