XRP, Dogecoin, Polkadot Price Analysis: 10 April

Despite the bullish resurgence over the last month, the buyers could not sustain the overall sentiment in the ‘neutral/greed’ zone. Thus, XRP and Polkadot continued to depict a bearish edge on their 4-hour technicals. While the former still had a hopeful CMF, the latter saw a death cross on its EMA.
On the other hand, Dogecoin was above its near-term EMA’s. But its bulls had to ensure the RSI equilibrium for a continued revival in the coming days.
XRP
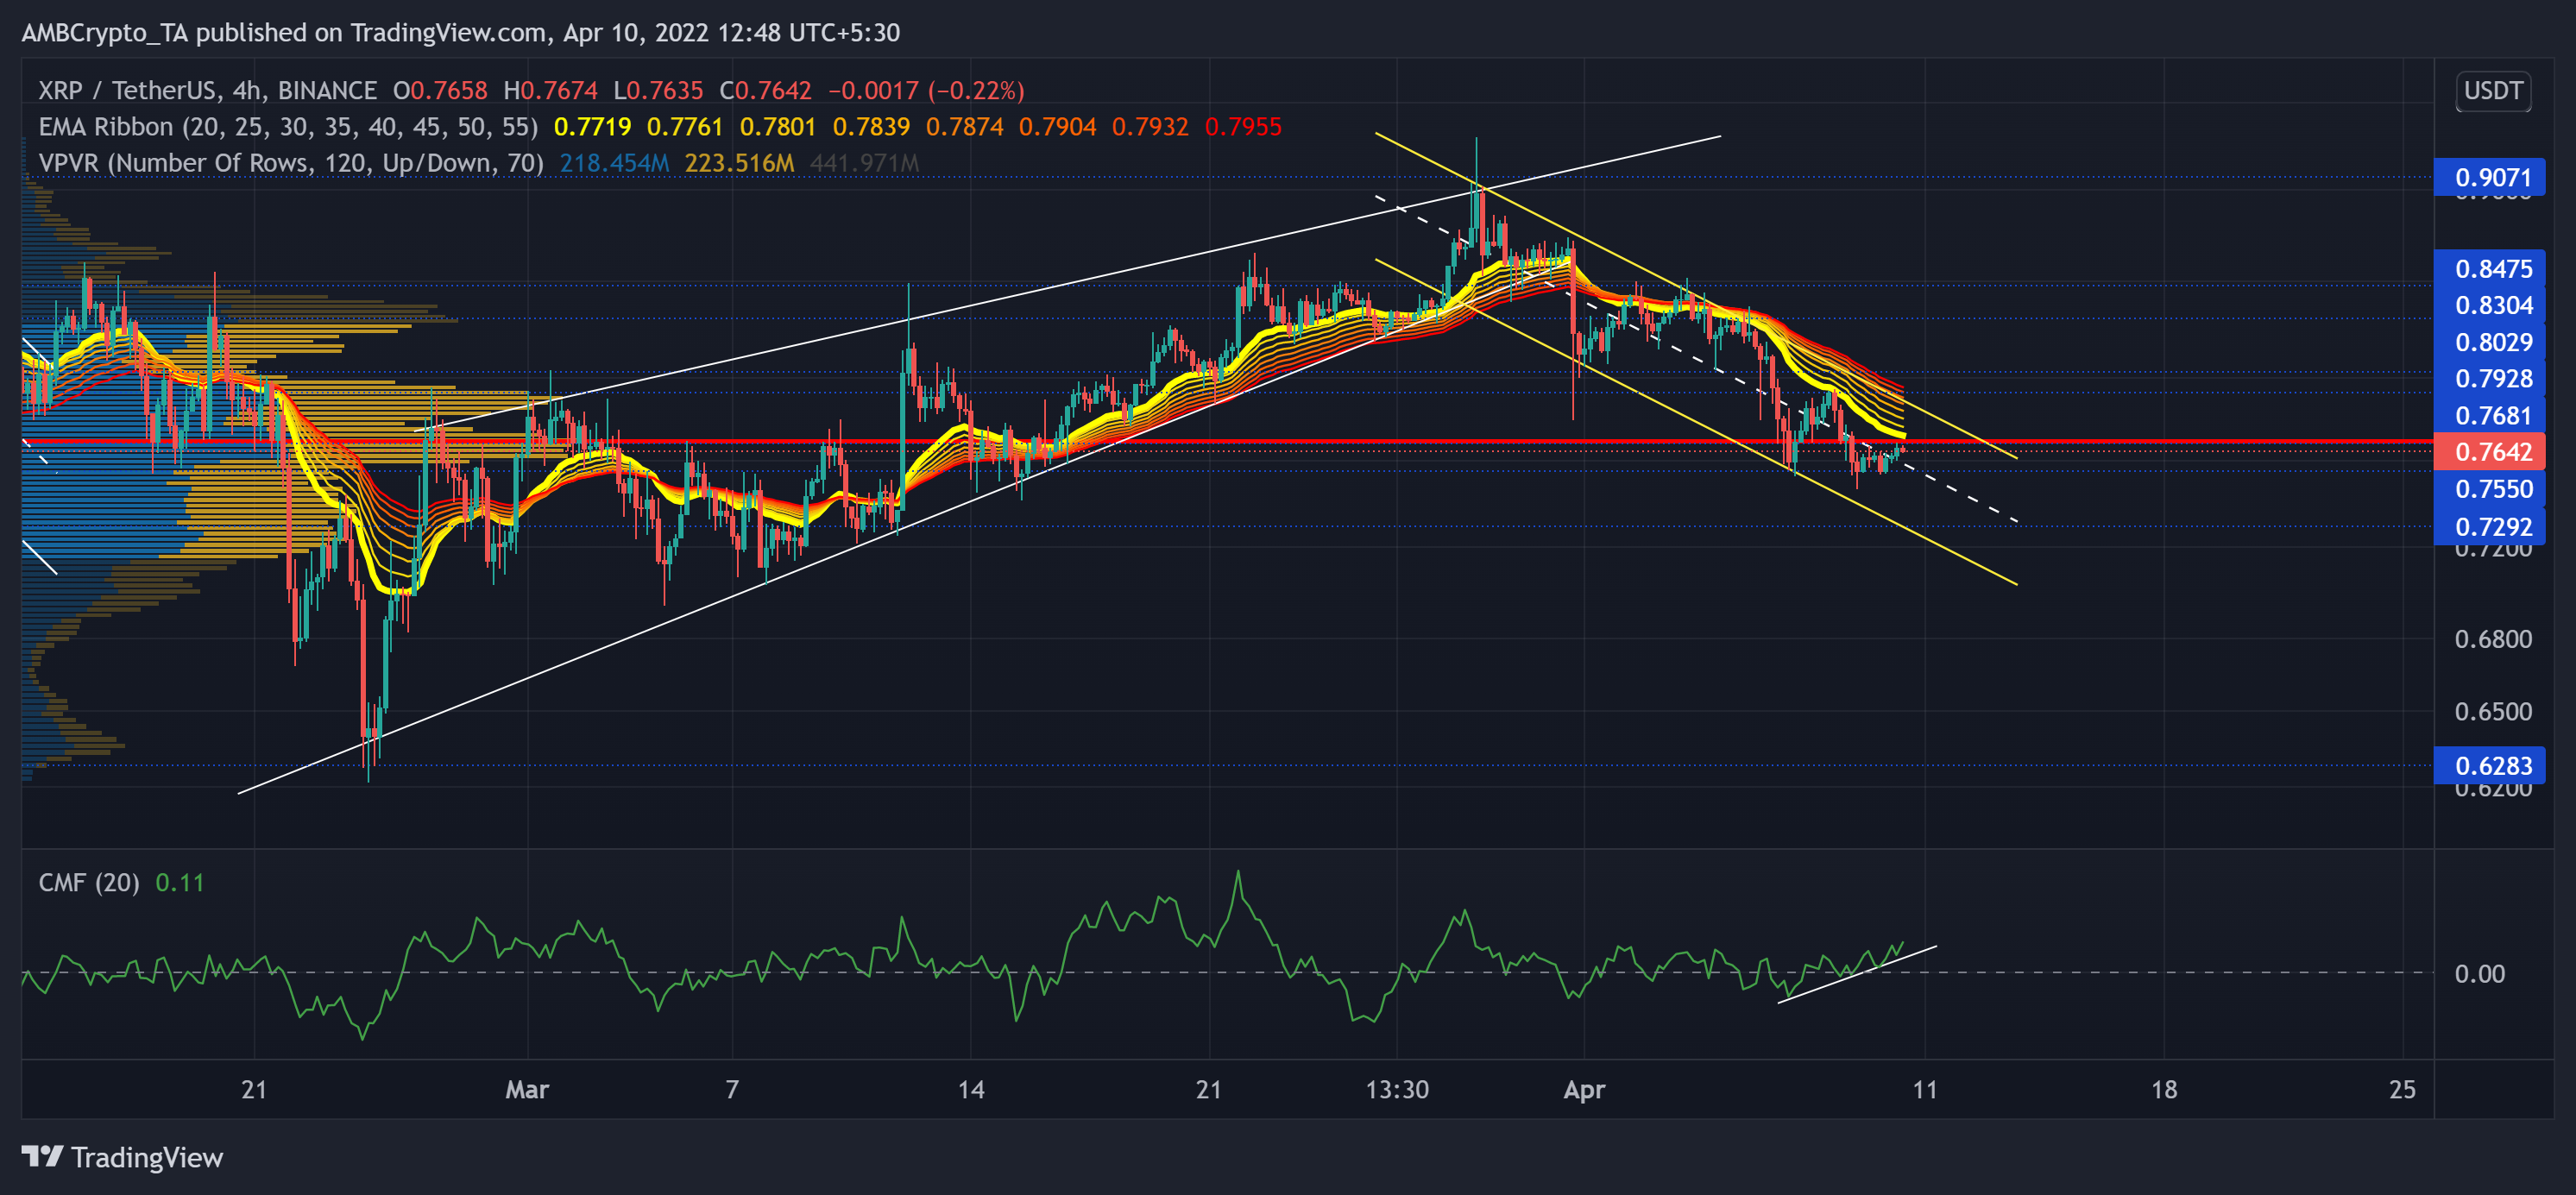
Since XRP fell towards its six-month low on 22 January, the bulls stepped in to defend the $0.56-base.
Consequently, with an over 69% revival, XRP flipped the EMA ribbons toward the bullish side and tested the $0.9-level. However, soon after, the bears were quick to propel a rising wedge breakdown while XRP fell below all its EMA ribbons. Meanwhile, it lost the Point of Control (POC) as the sellers initiated a heightened sell-off.
At press time, XRP was trading at $0.7642. The CMF depicted a buying edge as it managed to hover above the zero-line. Also, the recent movements revealed a hidden bullish divergence with the price and confirmed the increasing money flows into the crypto.
Dogecoin (DOGE)
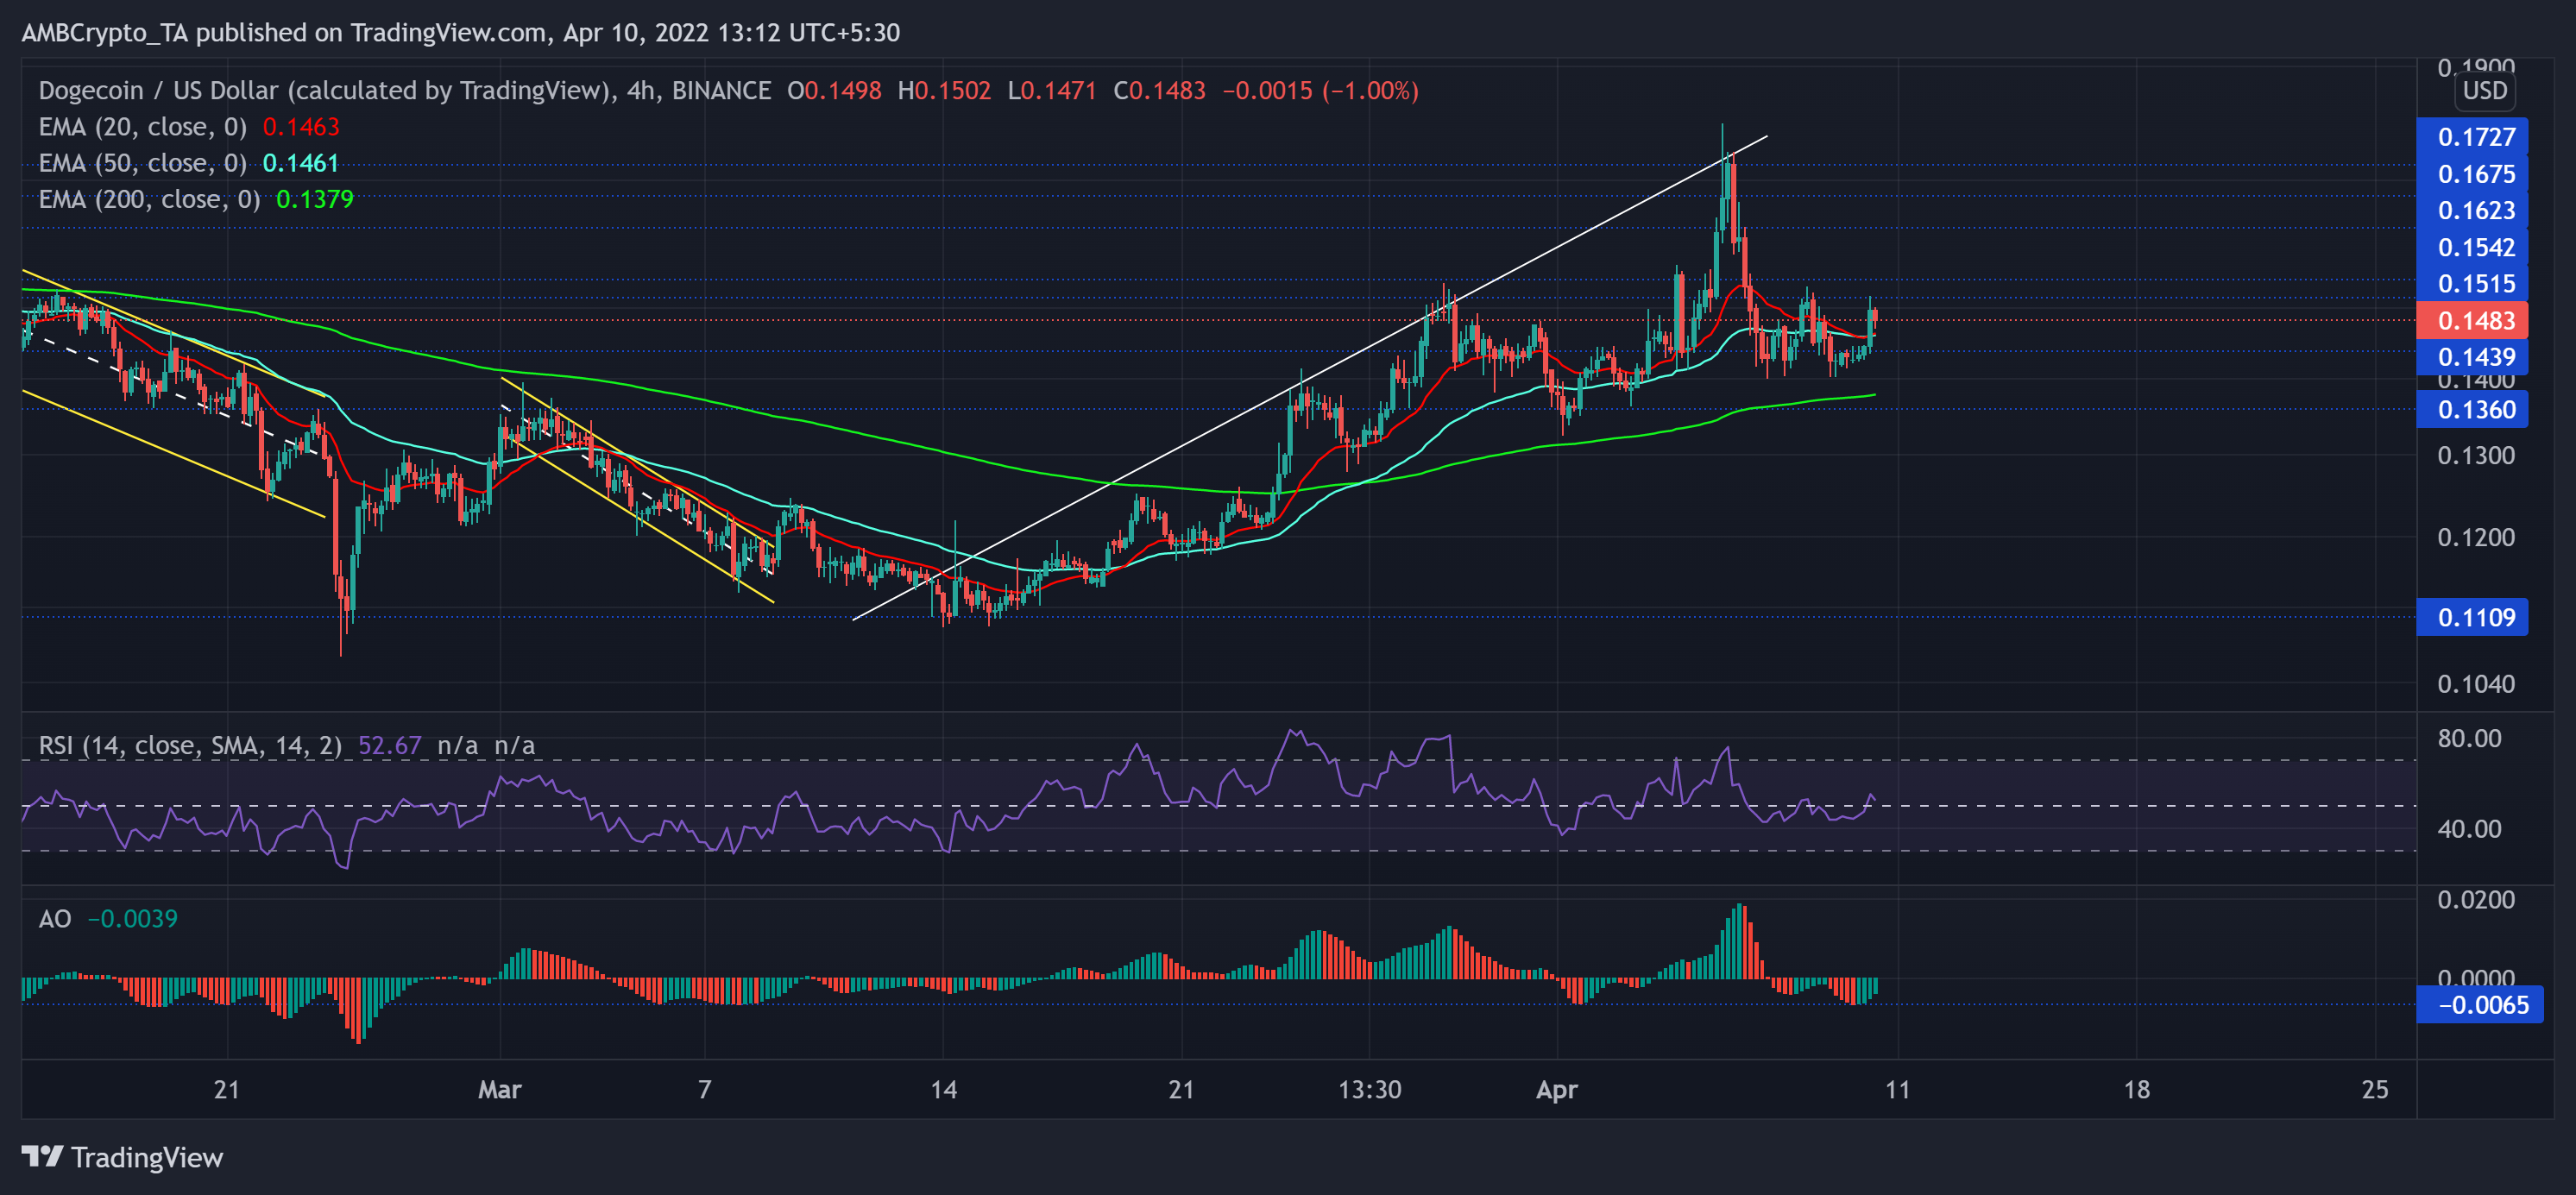
After swooping from the $0.16-mark to test its long-term $0.11-base, DOGE recovered gradually and consistently on its 4-hour chart. The alt saw a nearly 38.5% ROI over the last month while it reclaimed the vital $0.14-support.
The recent rally pushed DOGE above the 20/50/200 EMA while the bulls aimed for an advantage. Now, the immediate hurdle for the bulls stood at the $0.15-level.
At press time, DOGE traded at $0.1483. The RSI hovered below the midline for the last few days but finally found a close above the 50-mark. A fall below this level could propel a 200 EMA retest. Further, as the AO gravitated towards its immediate support, the bulls have ensured a revival from this level.
Polkadot (DOT)

The previous bearish phase (from its ATH) led the alt to lose more than 74.5% of its value and plunge toward its seven-month low on 24 February.
However, the recent bullish rally marked bullish trendline support (now resistance) (white, dashed) while the alt crossed the $23-mark. This rally seemingly found hindrance near its Point of Control (POC, red). Consequently, the bulls lost their advantage while the DOT witnessed an expected rising wedge breakdown. As a result, the 20 EMA fell below the 50/200 EMA and reaffirmed the bearish strength.
At press time, DOT was trading at $19.71. RSI’s revival from the oversold mark halted at the 40-mark resistance. Thus, the sellers claimed an upper hand in the current scenario. Moreover, with the +DI refusing to look north, DOT could eye at continued bearish movements in the near term.


