XRP, Dogecoin, The Sandbox Price Analysis: 27 November

Most cryptos saw a slackening November as the trend steadily swayed in favor of bears. Consequently, altcoins like XRP and Dogecoin touched their multi-weekly and monthly lows on 26 November.
Although SAND touched its ATH on 25 November, the near-term technicals hinted at its decreasing bullish force.
XRP

Succumbing to the market trend, Ripple’s XRP performed quite poorly after striking its two-month high on 10 November. Since then, the bulls visibly failed to counter the sell-off as the trend flipped in favor of bears. With this downfall, XRP formed a descending triangle pattern.
Further, this pullback resulted in a descending triangle breakdown as bears breached the lower trendline (yellow). As a result, a 29.15% correction (from 10 November) led the price to touch its two-month low on 26 November.
At press time, XRP was trading at $0.9518 after noting a 7.08% 24-hour loss. The RSI saw a 10 point revival after slipping into the oversold region. Additionally, the DMI readings exhibit a bearish preference. Even so, the AO hinted at a possible near-term bull revival. Also, it is crucial to note that the downturn was on high trading volumes, depicting a strong bearish move.
Dogecoin (DOGE)
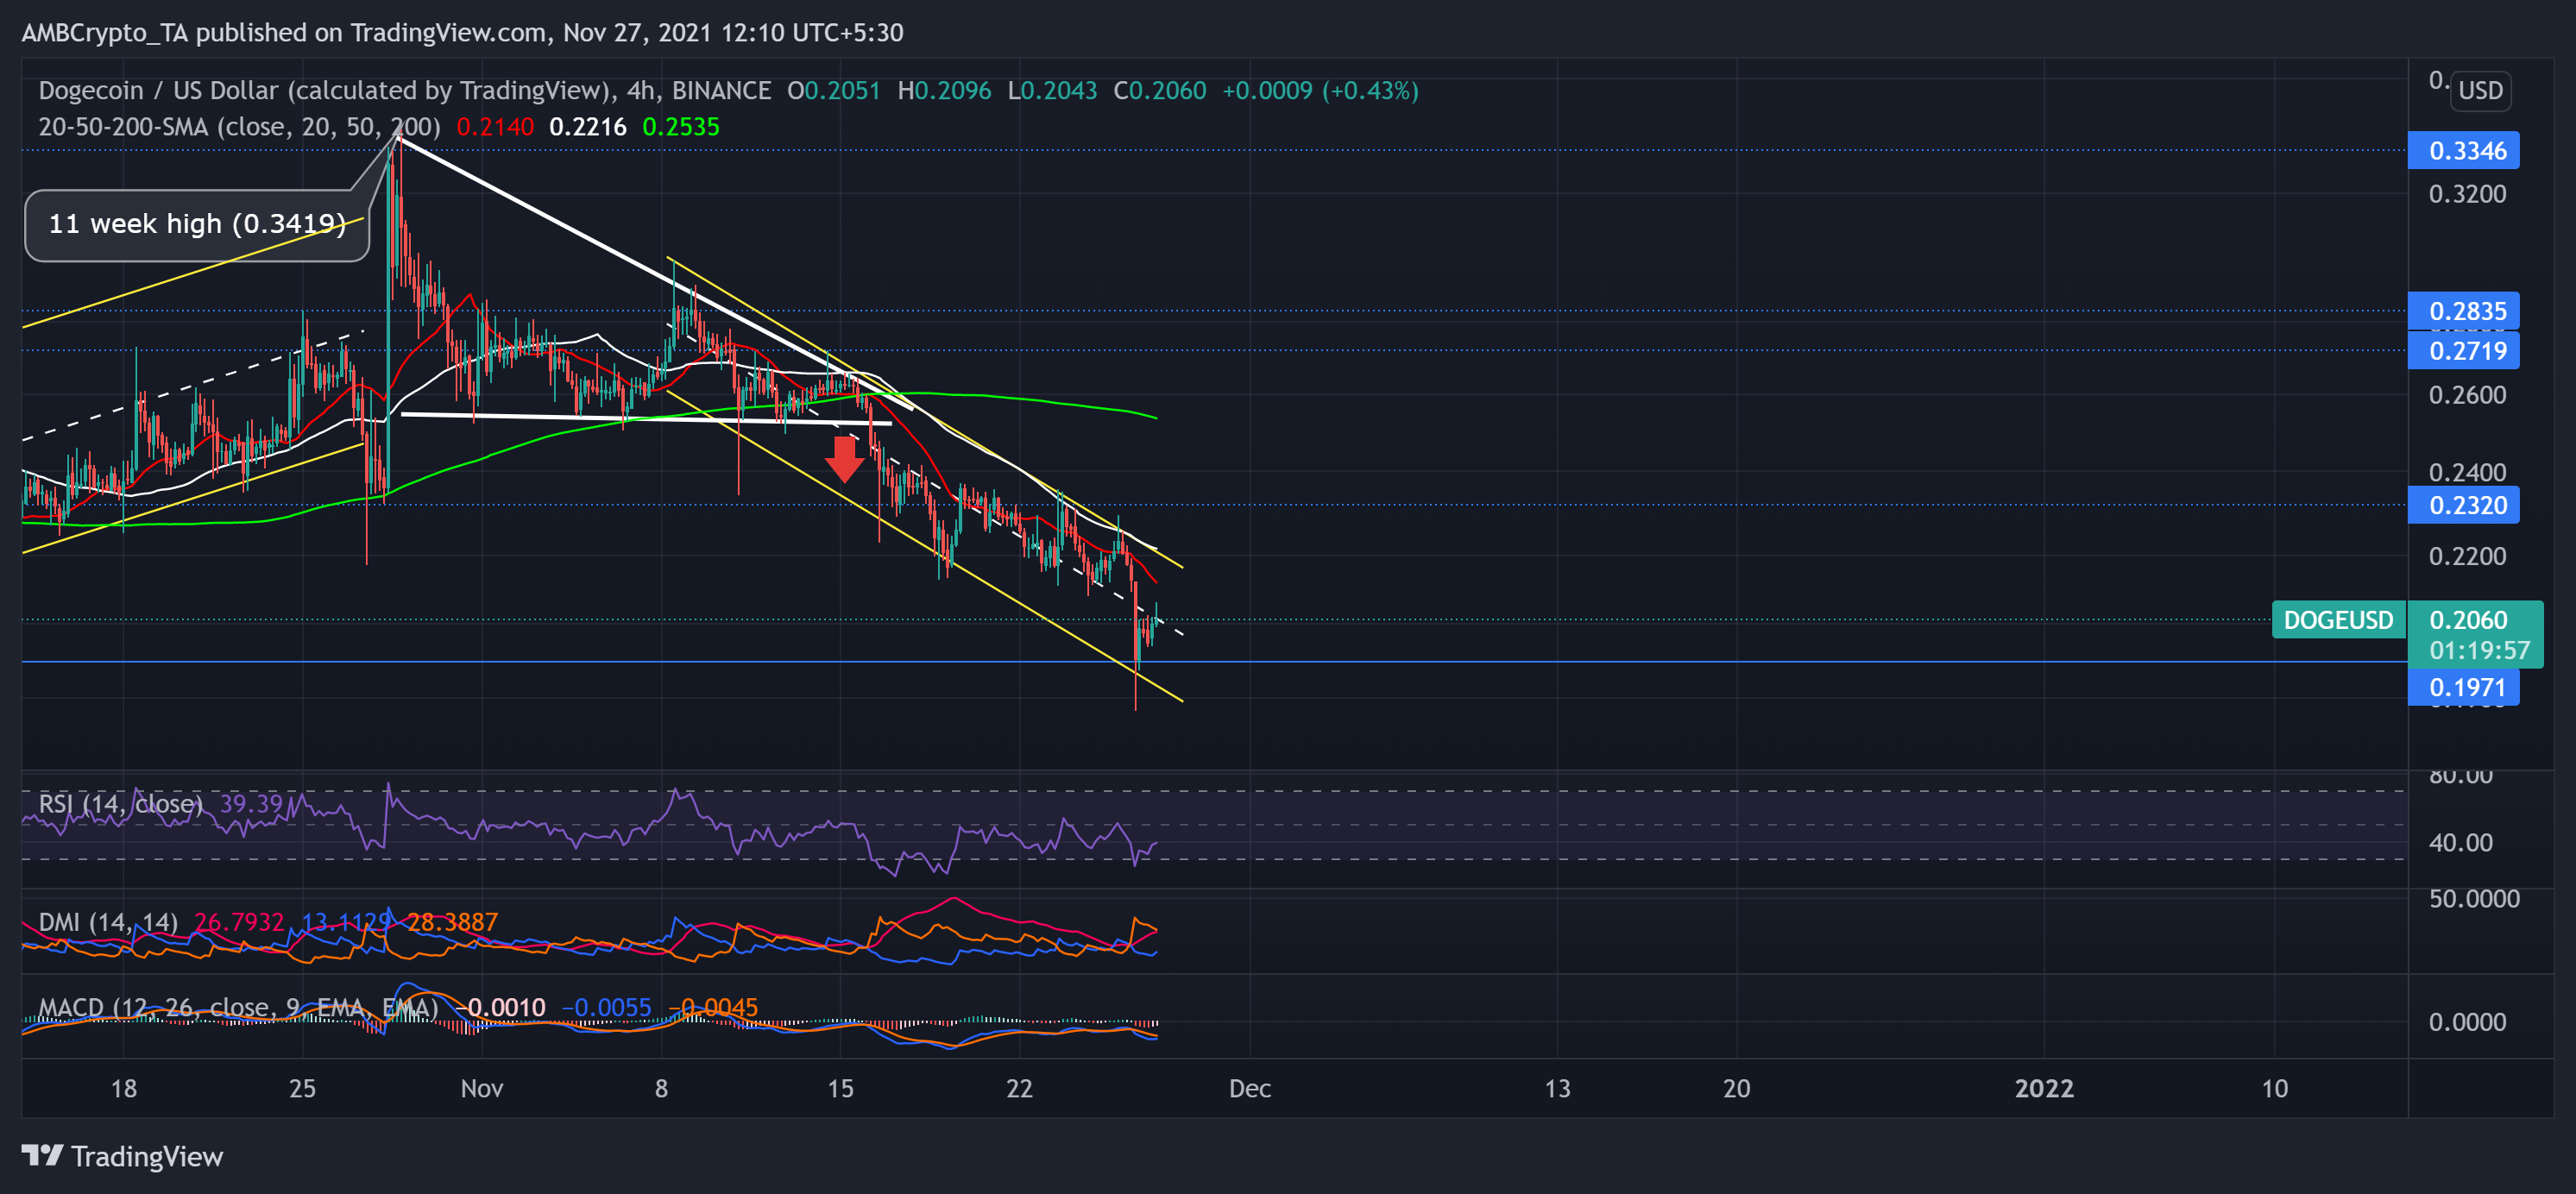
Doge has persistently slumped over the last month after attaining its 11-week milestone on 28 October. During this phase, the price steadily withdrew in a descending triangle (white). The price action transposed into a down channel (yellow) post a descending triangle breakout.
It lost over 39% of its value from 28 October to 27 November. Consequently, it touched its four-month low on 26 November. The bears swiftly breached the $0.2320-mark (immediate resistance) and pushed the price below its 4-hour 20-50-200 SMA.
At press time, DOGE traded at $0.206. The RSI depicted a bearish preference but saw a 13 point revival in 24 hours. Although the DMI had a bearish bias, the +DI line (blue) looked north.
The Sandbox (SAND)
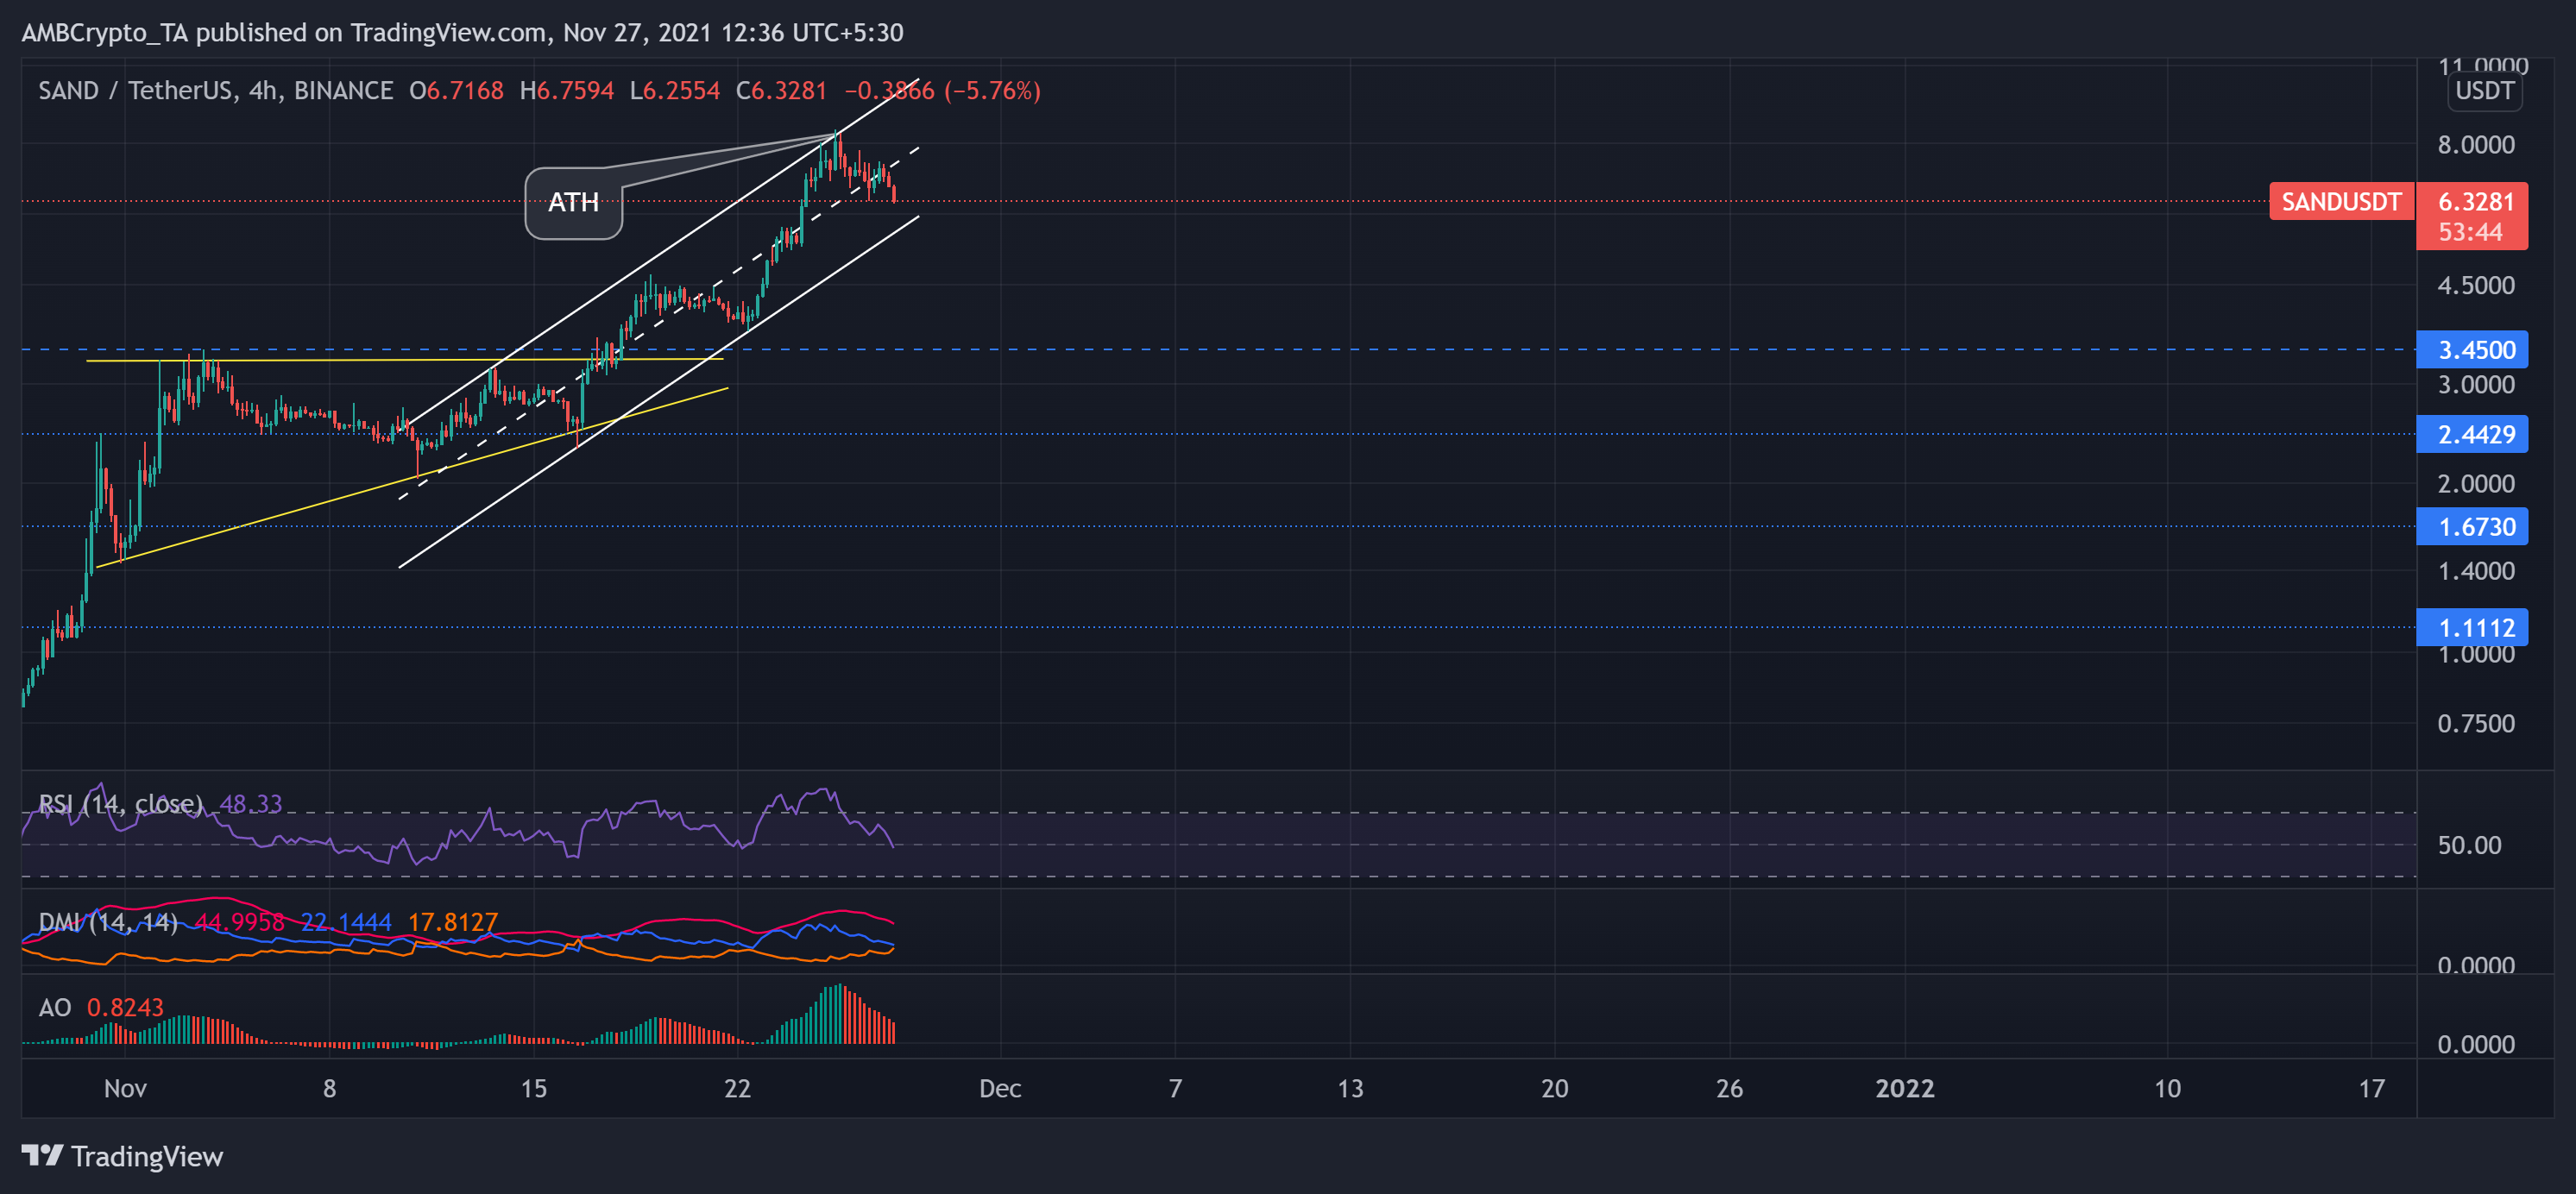
Being one of the leading metaverse tokens, SAND projected an inverse price movement. Thus, unlike most cryptos, the Ethereum-powered alt saw exponential gains over the past month. From 28 October, SAND saw an exceptional 508% rally as it touched its then ATH on 18 November.
The price action formed an ascending triangle pattern (yellow). Further, the recent tie-up with Adidas and its developments in the metaverse bolstered the price action to touch its ATH on 25 November. This upturn led to an ascending triangle breakout which further transformed into an up-channel (yellow).
However, at press time, the alt traded at $6.3281 after noting a 9.1% 24-hour loss. The RSI plunged from the 63-mark to the equilibrium point. Further, the DMI was on the verge of a bearish crossover. Also, the AO reaffirmed the previous readings by displaying a bearish bias.