XRP, EOS, Sushi Price Analysis: 7 December

The bulls triggered an impressive run over the past days after a sharp value diminution on 3 December. Thus, after poking their 46-week lows on 3 December, EOS and Sushi registered double-digit gains on their daily charts.
The near-term technicals for XRP, EOS, and Sushi indicated a bullish rise, but the overall outlook still remained bearish.
XRP
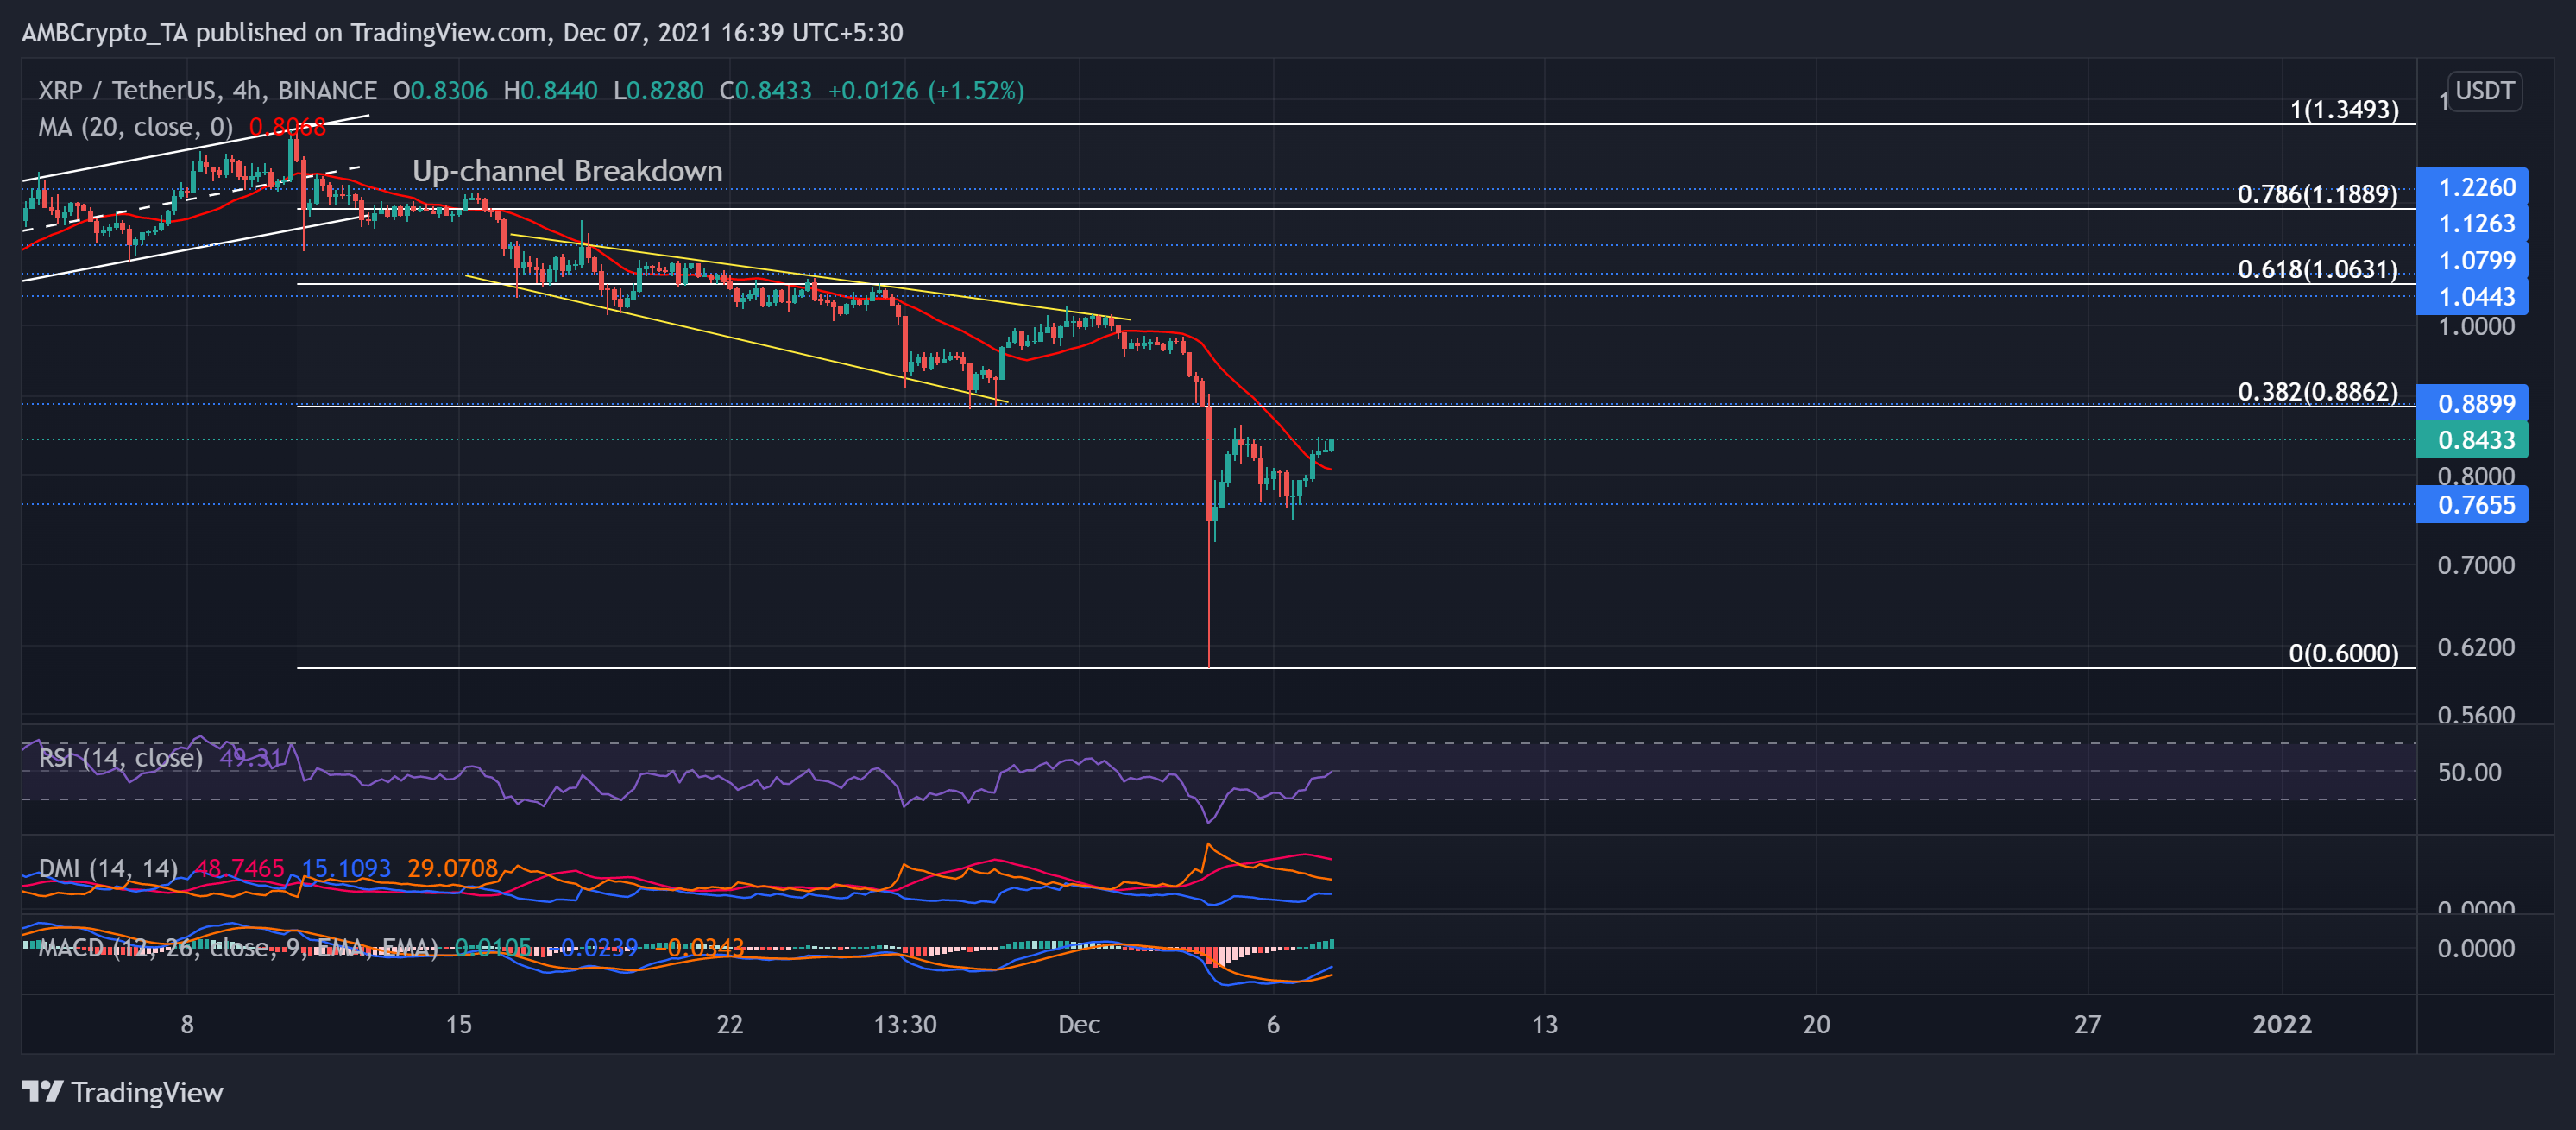
After hitting its two-month high on 10 November, Ripple’s XRP lost more than half of its value and touched its four-month low on 3 December. The alt marked a falling broadening wedge (yellow) post an up-channel breakdown.
As the price fell below the golden 61.8% Fibonacci level, a further breakdown occurred below the 16-week long resistance at the $0.88-mark.
However, as the bulls ensured the $0.765-support, the alt traded at $0.8433 after noting a 10.7% 24-hour gain. As a result, the price crossed its 20-SMA, indicating a near-term bullish comeback.
Now, unless the bulls can induce an upswing on increased volumes, the 38.2% Fibonacci stood as a solid hurdle.
The RSI managed to reach near the midline over the past five days. Also, the DMI hinted at a continuing bearish influence in the near term. However, the MACD histogram crossed the zero level and depicted increased bullish power.
EOS
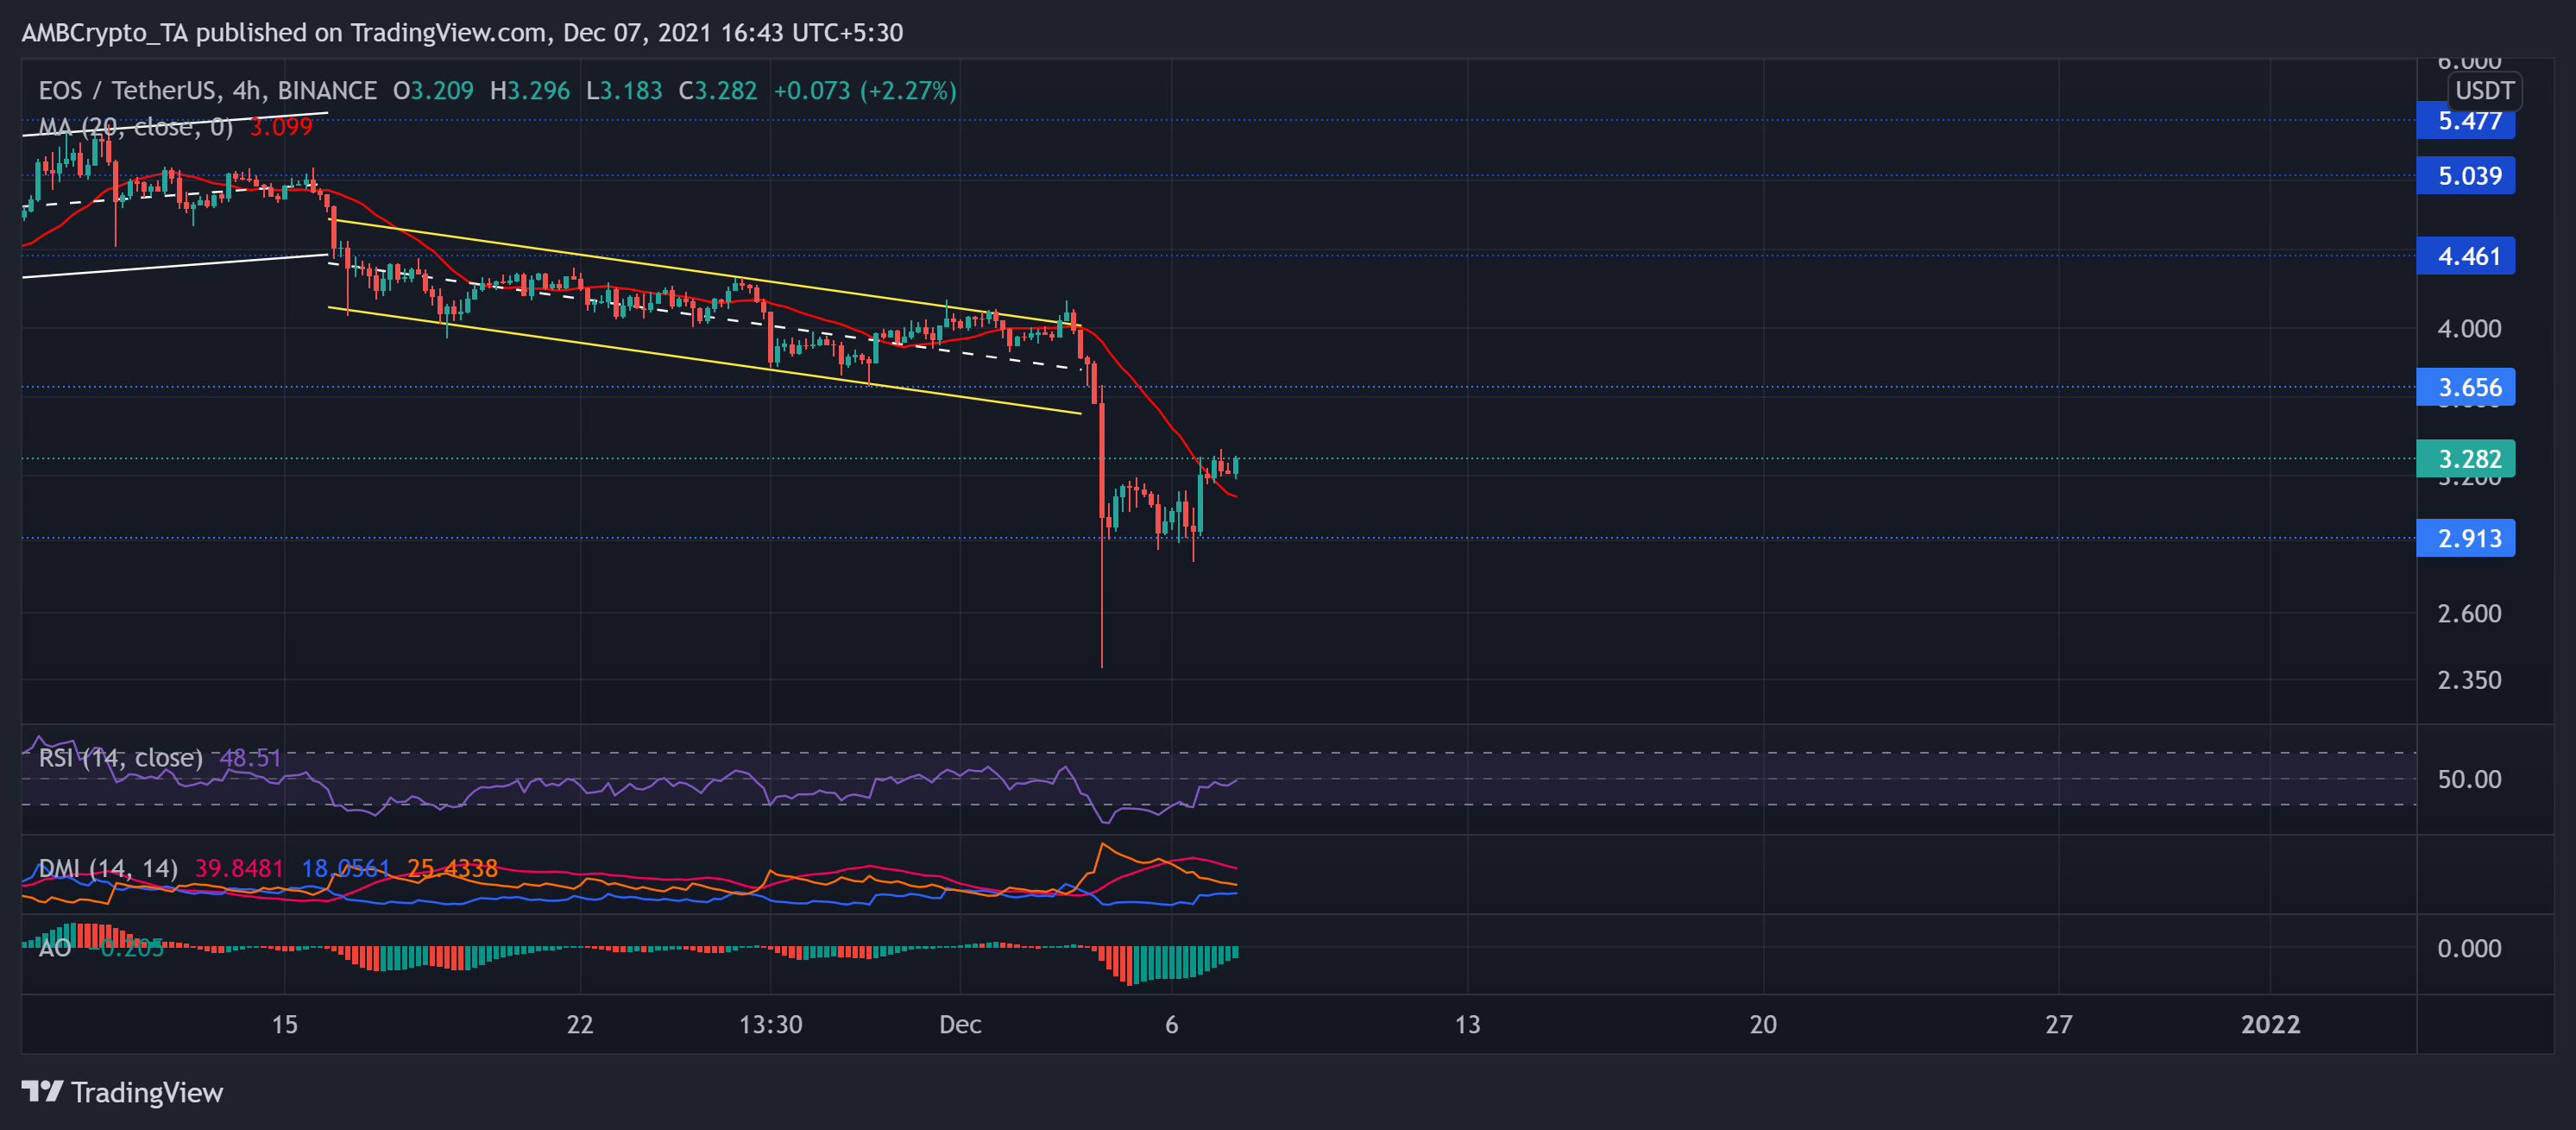
EOS correlated with market tendencies and obliged the 12-week-long resistance (at the $5.4 mark) after poking its seven-week high on 10 November. As the bearish phase kicked in, EOS witnessed an up-channel breakdown and oscillated in a down-channel (yellow).
The bulls needed to sustain the four-month resistance at the $3.65-mark. But, they failed to uphold that level causing a further breakdown toward its 46-week low at $2.39 on 3 December.
However, at press time, EOS traded at $3.282 after noting a 12.34% 24 hour gain. The RSI saw an 18 point surge over the past day after showing strong revival signs. The DMI continually preferred the bears with a high directional trend. On the flip side, the AO projected a near-term bullish comeback.
SushiSwap (SUSHI)
Post an over 30% rally to its seven-week-high on 2 November, SUSHI diligently downturned over the past month. As a result, the price steadily declined, forming a descending channel (yellow).
Since 18 November, the price refrained from retesting the upper parallel channel and moved below the midline (white, dashed). Consequently, SUSHI saw a further breakdown and breached its 19-week resistance at the $7.8 mark (immediate resistance).
After a slight uptrend on 28 November, SUSHI formed a double-top with the neckline at the $7.3-mark. Moreover, the massive sell-off accelerated the breakout as the alt poked its 46-week low on 3 December.
At press time, SUSHI traded at $6.085 after noting a 23.6% 24-hour gain.
The RSI saw a sharp surge but showed weakening signs near the midline. Also, the DMI visibly displayed the increased bullish power, but the +DI failed to cross the -DI line. Like XRP, the 38.2% Fibonacci served as a strong near-term hurdle.


